
Nike (NYSE:NKE) stock signal, a fundamental snapshot, and a technical view on where its share price is heading. What to know before the market opens on April 2nd, 2026, after NKE closed at $44.63, down 15.51% during the previous session, before sliding 0.96% in after-market hours.
Short Trade Idea
Enter your short position between $44.20 (its after-market close) and $46.83 (yesterday’s intra-day high).
Market Index Analysis
Nike (NYSE:NKE) is a member of the S&P 100 Index and the S&P 500 Index.
Both indices remain inside bearish price channels with elevated downside pressures.
The Bull Bear Power Indicator for the S&P 500 Index turned bullish but remains below its descending trendline.
Market Sentiment Analysis
Equity futures are slumping this morning following President Trump’s Iran war speech last night, reversing nearly half of the previous session’s gains. Oil prices spiked over 5%, trading above $100 per barrel, as the Iran war will last at least a few more weeks, with President Trump once again promising heavy strikes against Iran. Initial jobless claims data will mark the economic highlight during the holiday-shortened week, but March NFP data will be released tomorrow, despite the markets being closed for Good Friday.
Nike Fundamental Analysis
Nike is the world’s largest athletic footwear and apparel manufacturer, one of the leading sports equipment manufacturers, and the most valuable sports brand.
So, why am I bearish on NKE despite its earnings beat?
While Nike beat on the top and bottom line, $11.28 billion in revenues and $0.35 in earnings per share versus expectations of $11.23 billion and $0.29, respectively, it guided to a 20% plunge in Greater China sales this quarter. I am equally bearish on its European business, which remains heavily promotional to defend market share. Competition from Chinese and European brands is notably high, putting pressure on profitability and margins. Market share erosion in the premium sportswear apparel sector is likely to accelerate.
Metric | Value | Verdict |
P/E Ratio | 29.36 | Bearish |
P/B Ratio | 4.69 | Bearish |
PEG Ratio | 0.98 | Bullish |
Current Ratio | 2.06 | Bullish |
ROIC-WACC Ratio | Positive | Bullish |
Nike Fundamental Analysis Snapshot
The price-to-earnings (P/E) ratio of 29.36 makes NKE an expensive stock. By comparison, the P/E ratio for the S&P 500 Index is 26.04.
The average analyst price target for NKE is $67.09. It suggests excellent upside potential, but downside risks remain elevated.
Nike Technical Analysis
Today’s NKE Signal

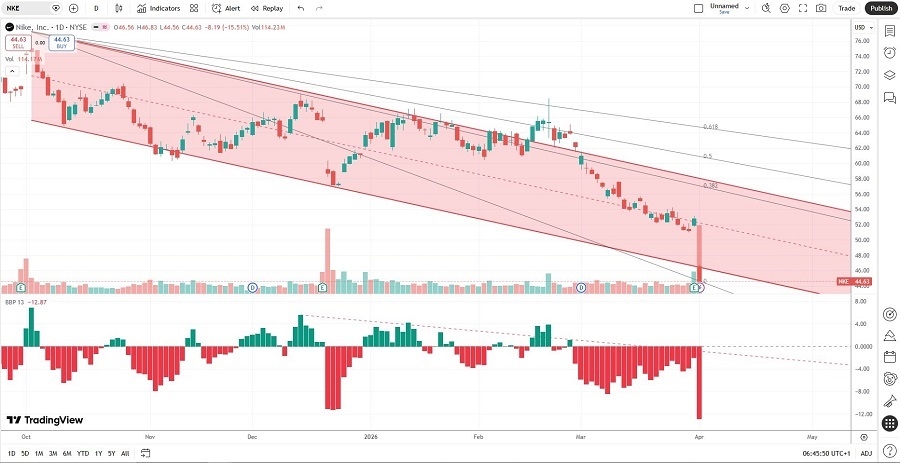
Nike Price Chart
The NKE D1 chart shows price action breaking down below its bearish price channel.
It also shows price action between its descending 0.0% and 38.2% Fibonacci Retracement Fan levels.
The Bull Bear Power Indicator is deep in bearish territory with a descending trendline.
The average bearish trading volumes are higher than the average bullish trading volumes.
NKE plunged as the S&P 500 Index recovered, a significant bearish trading signal.
My NKE Short Stock Trade
NKE Entry Level: Between $44.20 and $46.83
NKE Take Profit: Between $28.94 and $30.13
NKE Stop Loss: Between $51.69 and $53.11
Risk/Reward Ratio: 2.04