
As rates rise, we continue to see the NASDAQ 100 struggle for real traction.
NASDAQ 100
NASDAQ 100 initially tried to rally during the trading session on Tuesday but has been beaten back by the massive number of concerns that we see around the world when it comes to interest rates and of course the situation in the Middle East. At this point in time, I think you have a scenario where the NASDAQ will continue to be very noisy. I think it continues to watch headlines, and it continues to watch interest rates, specifically the 10-year yield at the 4.30 level, an area that seems to be a switch for algos to go from risk-on to risk-off.
As rates rise, it makes things like technology, riskier stocks, a little less attractive, and that's part of what we've seen. Now having said that, it looks like we are trying to bounce. The question will be: will we get good news between now and the close to have the market celebrating? After all, if the Iranians do not choose to open up the Strait of Hormuz, it is thought—it has been threatened—that the Americans will blow up the infrastructure in Iran, and that would be a massive escalation.
A Massive Escalation in the Middle East
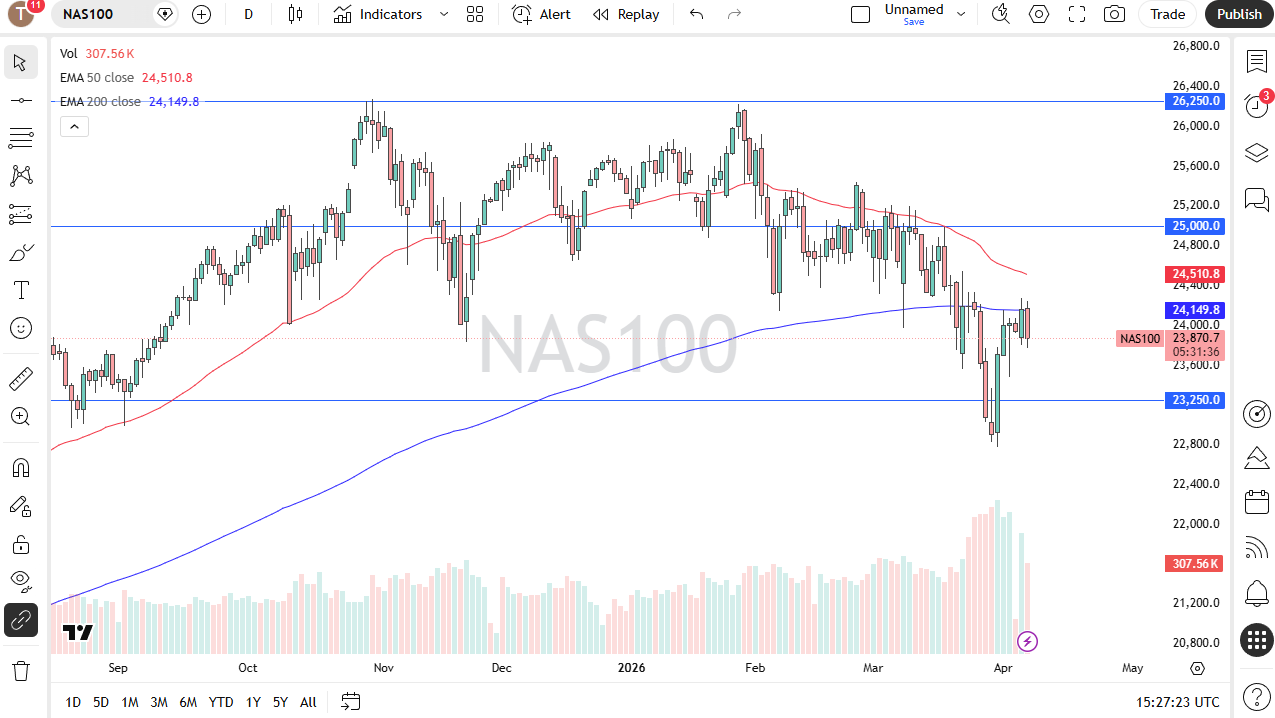
In that environment, it's very difficult to get overly aggressive and excited about owning really anything. This isn't just a NASDAQ problem; this becomes a problem for a lot of assets in general. So, with that being said, I am watching the 10-year yields quite closely. It is worth noting that a couple of hours into the session we are trying to recover. It's also worth noting that we failed right at the 200-day EMA.
If we can break above there, it could open up a move to the 50-day EMA. The 23,800 level is a bit of a floor, at least short-term, but if we start seeing massive strikes against the energy infrastructure in Iran, I suspect that floor gets violated and we go looking to the 23,250 level. Conversely, if we get good news, then we're probably looking at a recovery towards the 50-day EMA if not the 25,000 level.
As far as analysis is concerned, it looks like a nice V bottom, but this is all hanging on the next tweet or the next press conference or the next statement. Therefore, the only thing you can do is change your position size. Smaller position sizes are necessary.