
Bearish view
Sell the GBP/USD pair and set a take-profit at 1.3000.
Add a stop-loss at 1.3300.
Timeline: 1-2 days.
Bullish view
Buy the GBP/USD pair and set a take-profit at 1.3300.
Add a stop-loss at 1.300.
The GBP/USD exchange rate has slumped in the past few months, a trend that may continue this week as geopolitical risks rise. It dropped to 1.3200, down by nearly 5% from its highest point this year.
US Non-Farm Payrolls Data
The GBP/USD pair has slumped in the past few months, moving from a high of 1.3872 in January to the current 1.3200.
This retreat continued on Friday after the US released a strong jobs report, which showed that the economy created 178k jobs in March after shedding over 133k in the previous month.
The unemployment rate dropped slightly to 4.3% in March this year. However, analysts caution that the labor market is still weak since the job additions were mostly because of the upcoming World Cup, which will start in June this year.
The pair will react to the new developments in the Middle East, where Donald Trump has threatened to intensify his attacks against Iran infrastructure, which will lead to more attacks on key equipment and projects in the region.
This will, in turn, lead to higher crude oil prices this week. Indeed, Brent and the West Texas Intermediate (WTI) have jumped by over 100% from the lowest level this year, while the average gasoline prices soared to over $4.
These numbers mean that the US inflation will continue rising, making it hard for the Federal Reserve to cut interest rates this year. As a result, US bond yields have continued rising this year, with the ten-year and two-year moving to 4.3% and 3.9%, respectively.
The GBP/USD pair will also react to the upcoming US macro data, including the US services PMI, GDP, and Personal Consumption Expenditure (PCE) data.
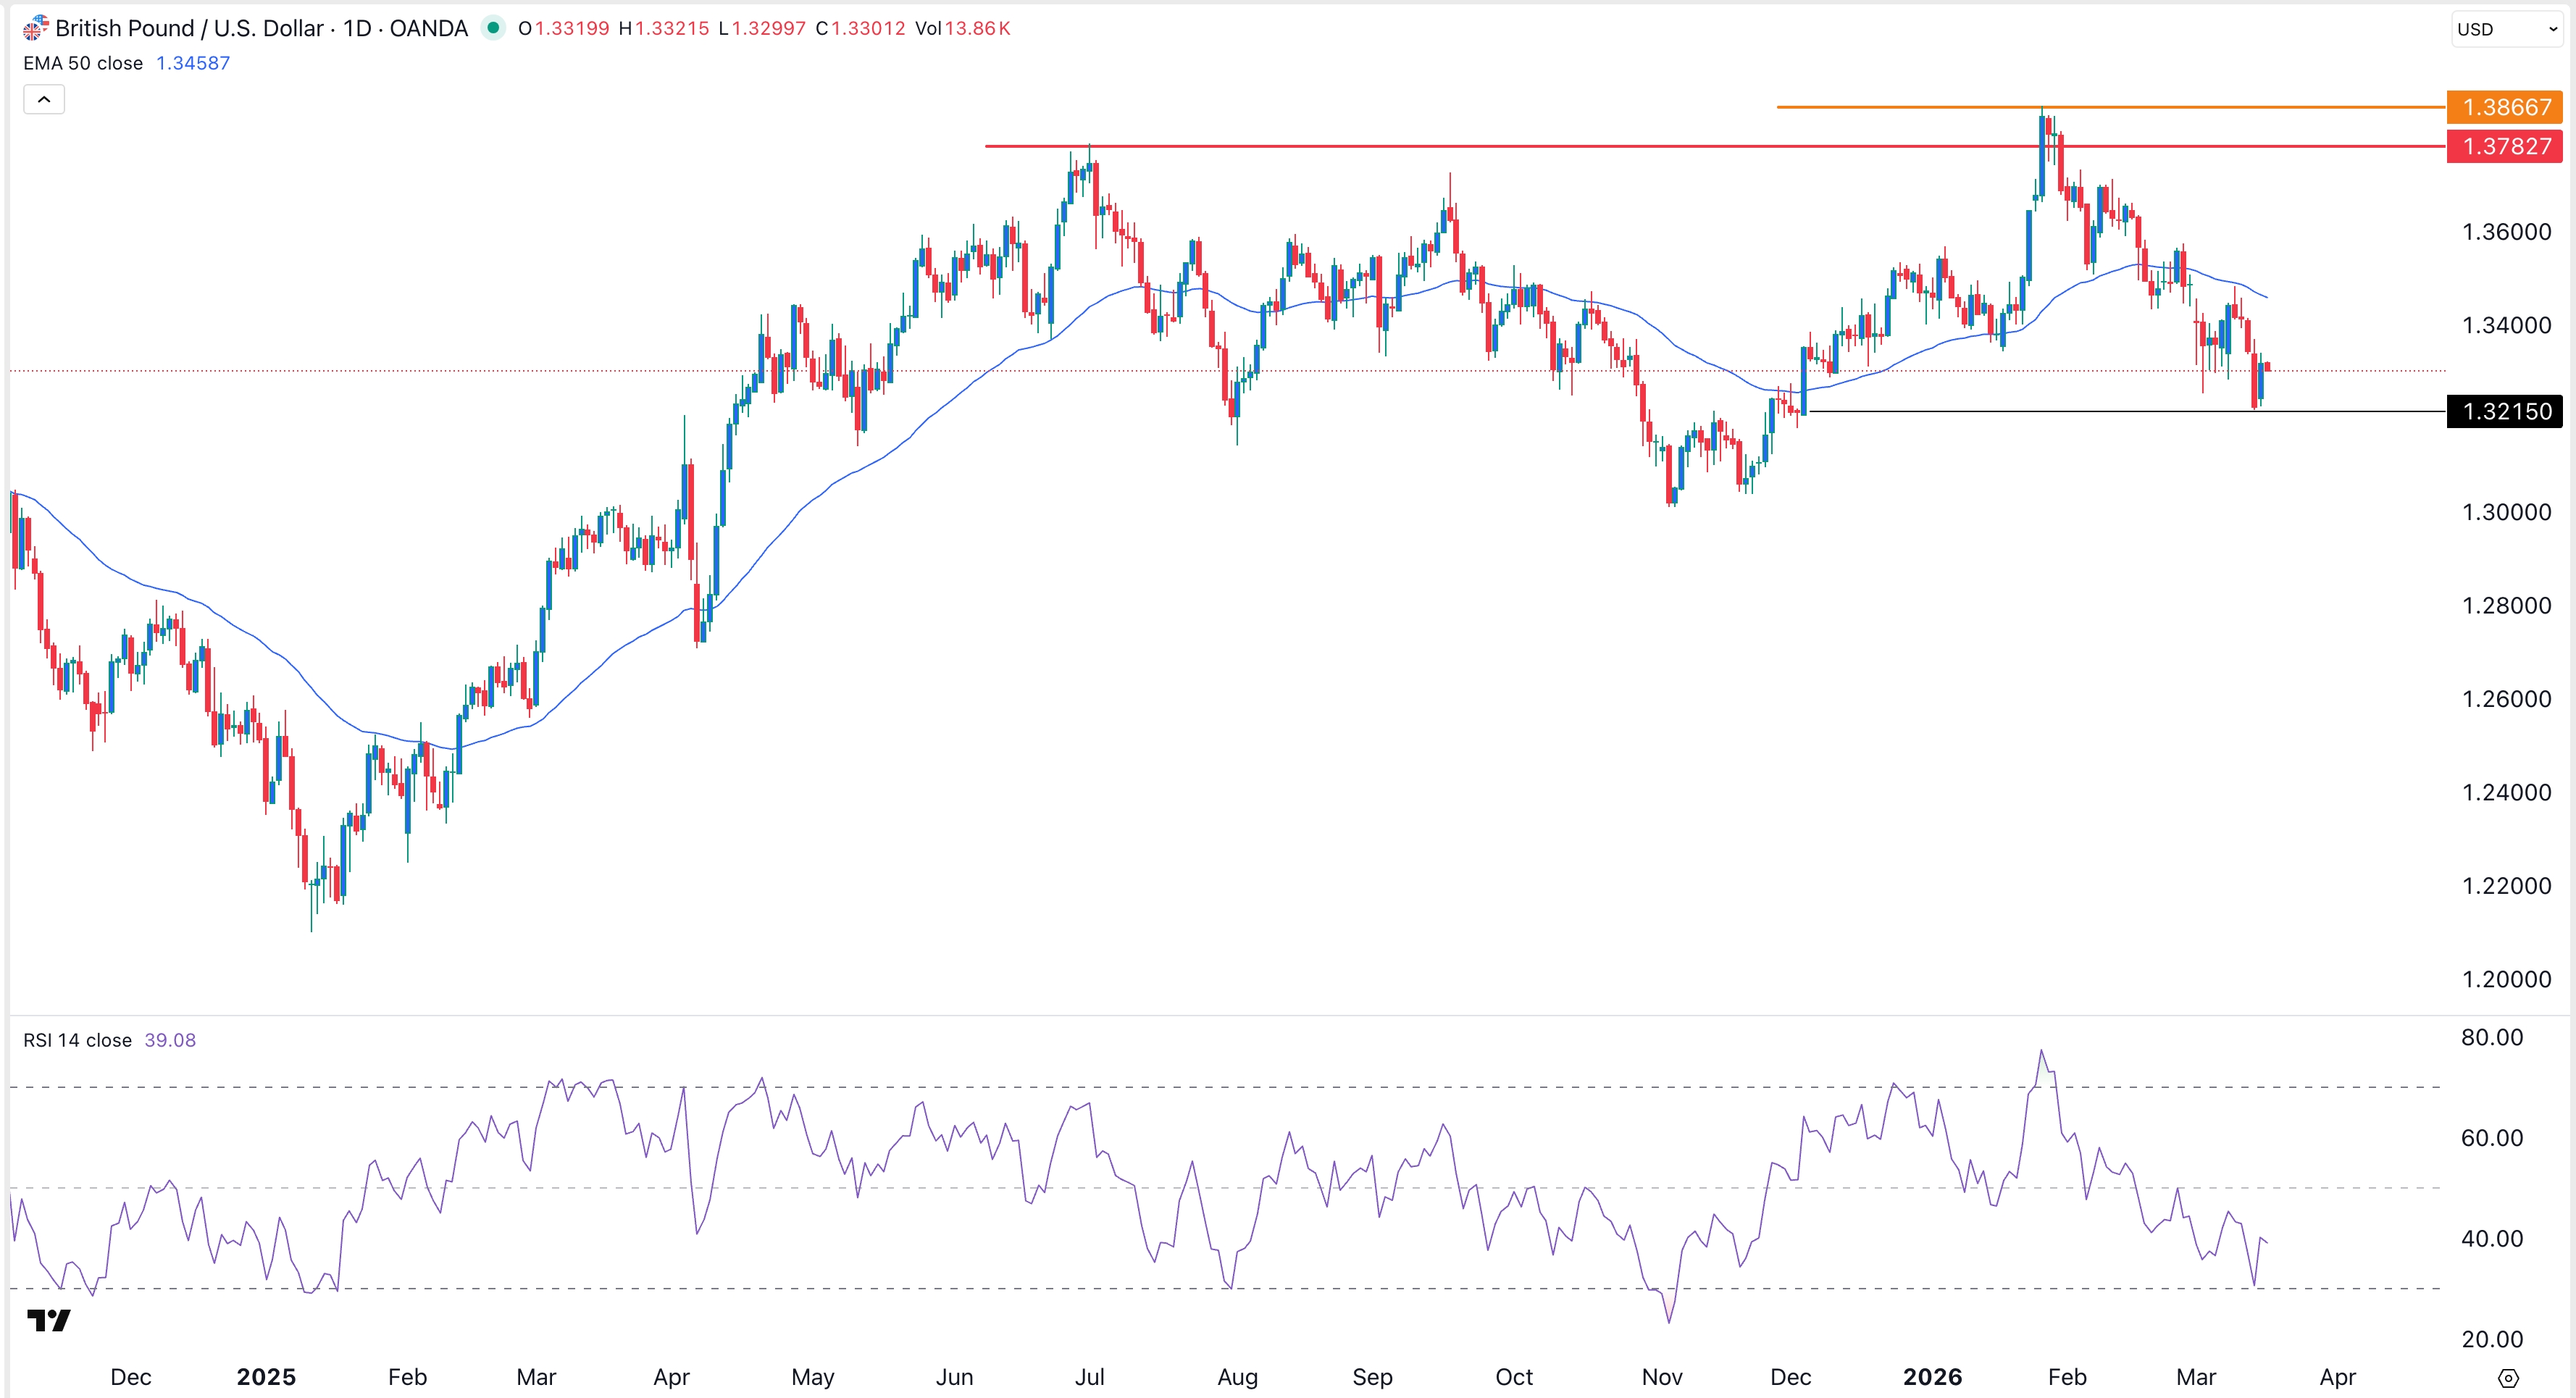
GBP/USD Technical Analysis
The daily timeframe chart shows that the GBP/USD pair has slumped in the past few months, moving from a high of 1.3872 in January to the current 1.3200. It has already formed a death cross pattern as the 50-day and 200-day Weighted Moving Averages (WMA) crossed each other.
The pair has also dropped to the 38.2% Fibonacci Retracement level. Top oscillators have continued falling, while the Average Directional Index (ADX) has soared to 32, its highest point since December last year, a sign that the downtrend is gaining momentum.
On the positive side, the pair has formed an inverted head-and-shoulders pattern and is now in the right shoulder section. This pattern will become invalid if it drops below the head section of 1.300.