
Bullish view
Buy the GBP/USD pair and set a take-profit at 1.3700.
Add a stop-loss at 1.3450.
Timeline: 1-3 days.
Bearish view
Sell the GBP/USD pair and set a take-profit at 1.3450.
Add a stop-loss at 1.3700.
The GBP/USD exchange rate will be in the spotlight later today, April 16, as the UK releases the latest GDP report. The US will also publish more data as traders focus on the developments in the Middle East, where the US and Iran are seeking more talks. It has jumped by over 3% from its lowest point this year, and this trend may continue after forming key chart patterns.
UK and US to Publish Key Macro Data
The GBP/USD pair has embarked on a prolonged rally as the ceasefire between the US and Iran continues. While the two sides have maintained their rhetoric, analysts believe that they will ultimately reach an agreement in the next few weeks.
Meanwhile, the UK and the US will publish major macro data that will provide hints on how their respective economies did before the war. Economists polled by Reuters expect the upcoming report to show that the economy expanded by 0.1% in February after stagnating a month earlier.
The UK is expected to release weak industrial and manufacturing PMI numbers. In normal times, these numbers would have an impact on the sterling. However, their impact this time will likely be muted as economic conditions changed in March, as the war upended business conditions, leading to higher inflation in the country.
The other key macro data to watch will be from the United States. For example, the Bureau of Labor Statistics (BLS) will publish the latest initial jobless claims report. The US will also release the latest Philadelphia Fed manufacturing index and industrial production report.
Additionally, several Federal Reserve officials, like Stephen Miran and John Williams, will deliver statements on what to expect.
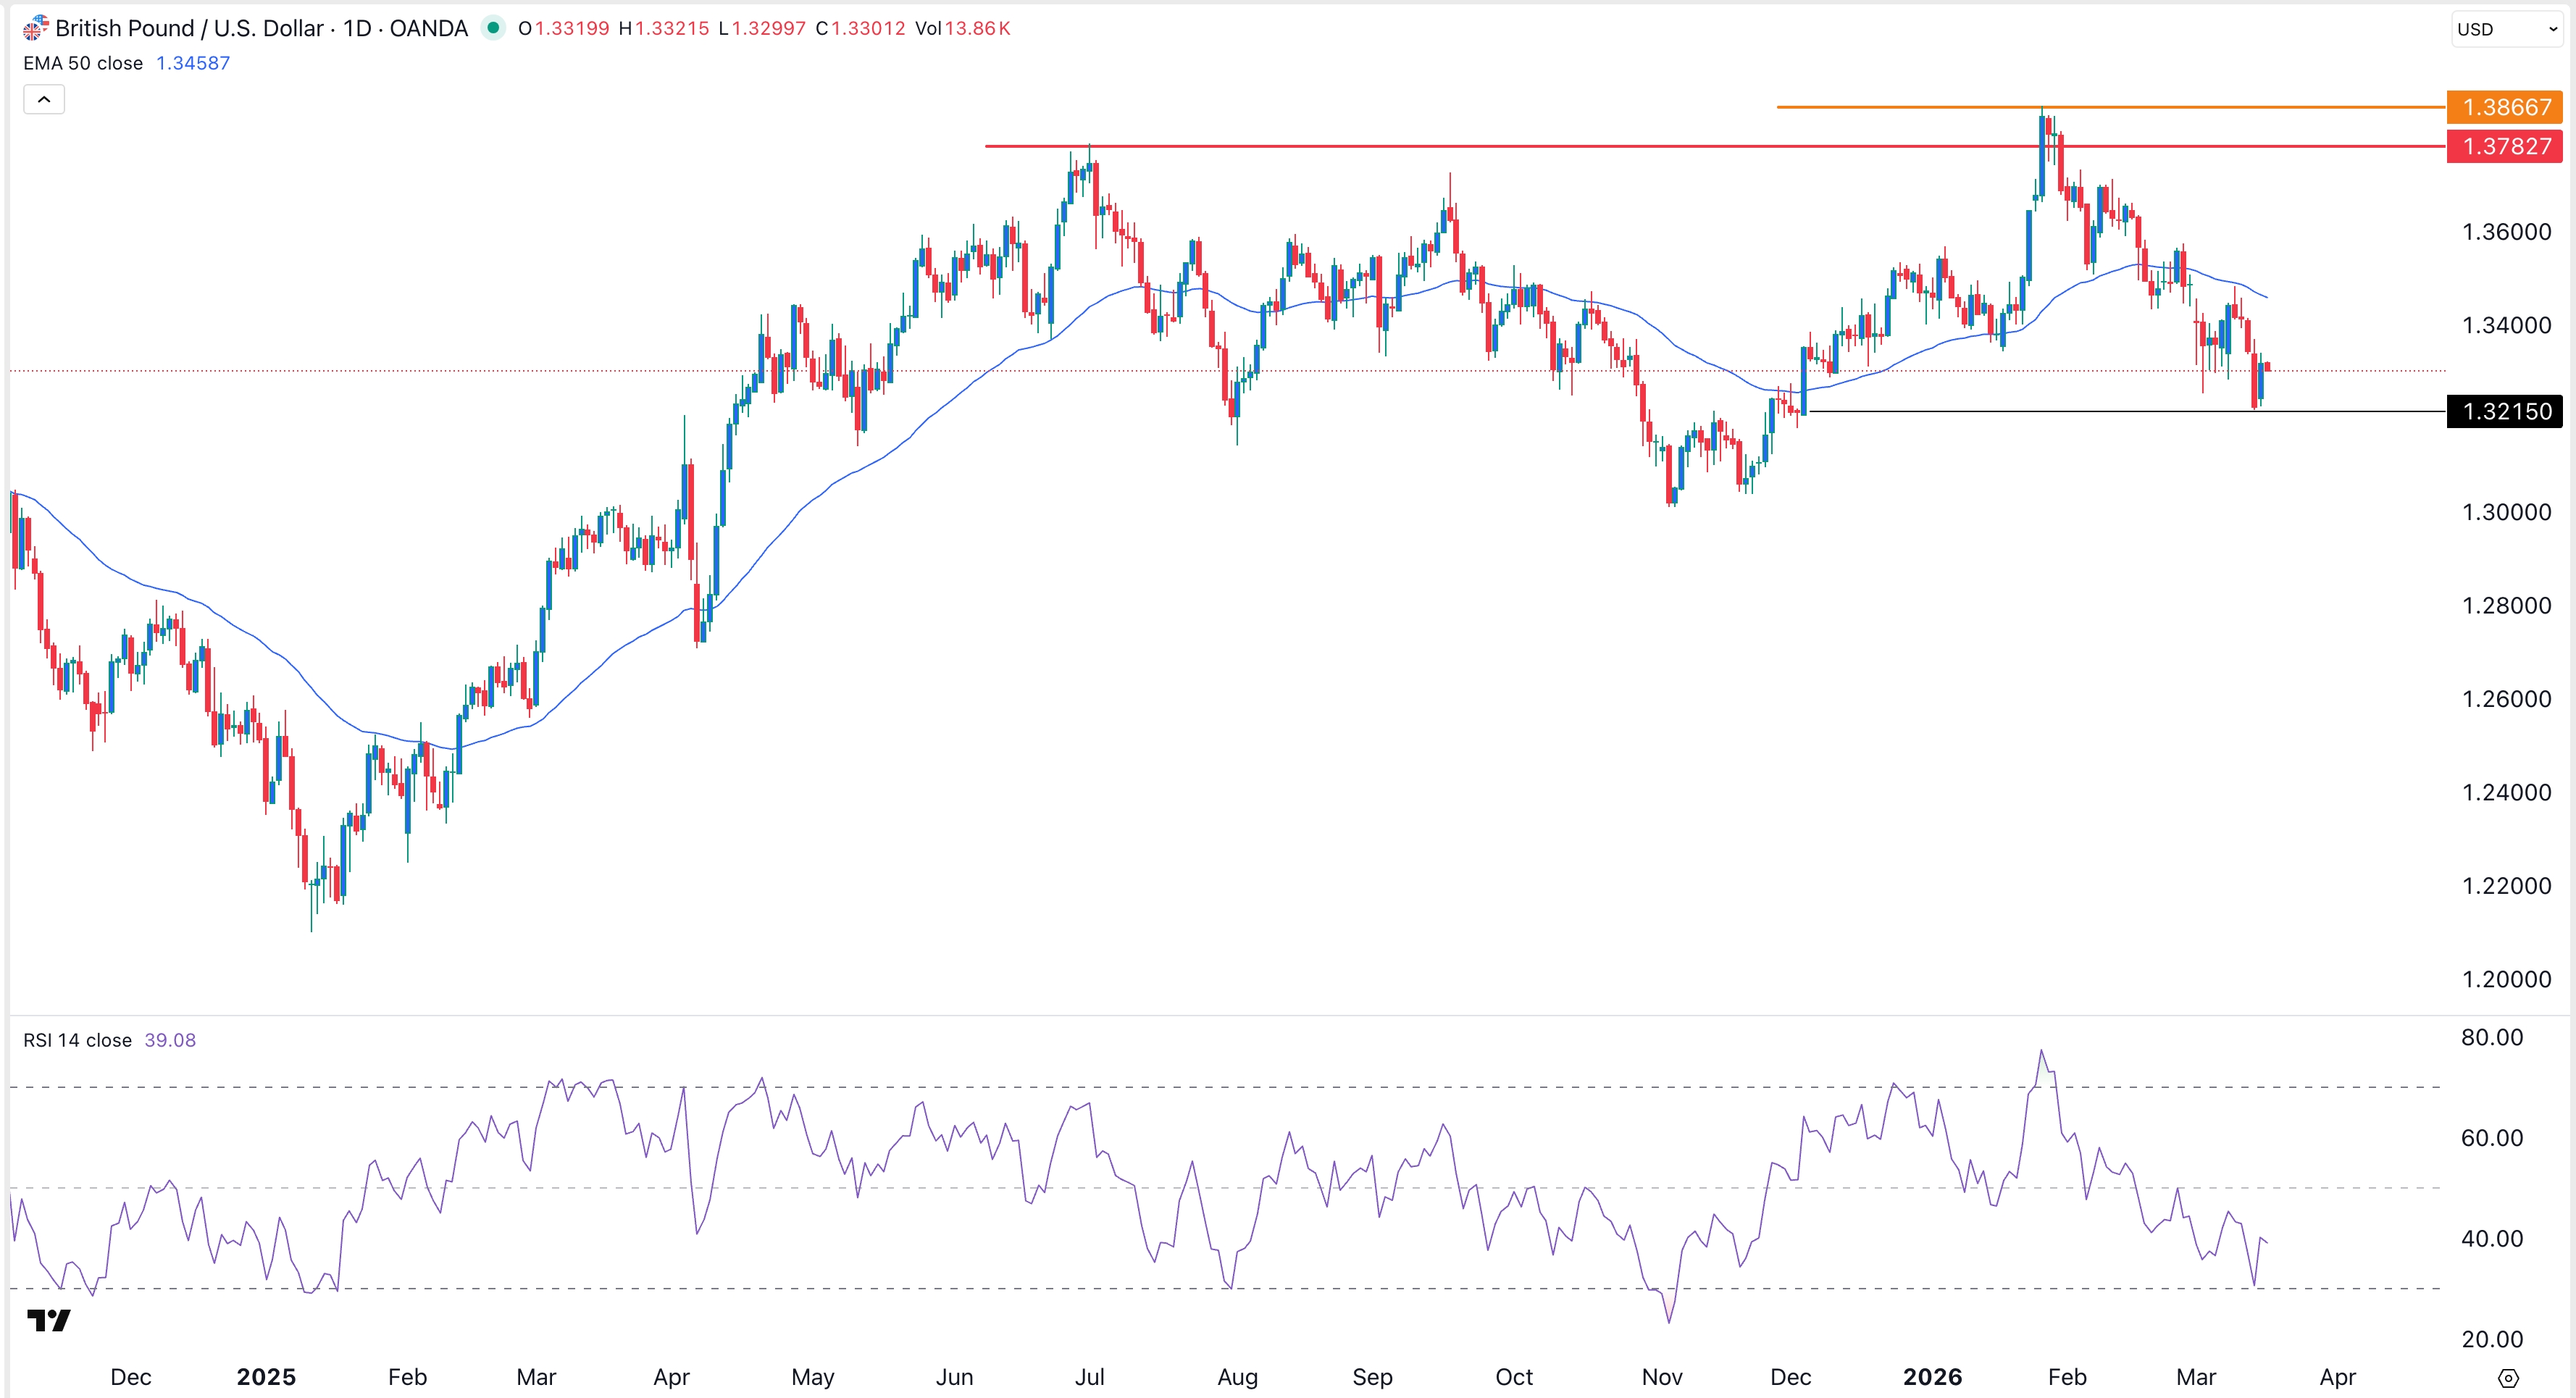
GBP/USD Technical Analysis
The three-day chart shows that the GBP/USD pair has been in a strong rally in the past few weeks. This retreat happened as global investors turned against the US dollar after the initial panic.
It has now jumped above the 50 and 100-day moving averages. Also, it formed an inverted head-and-shoulders pattern, which is a common bullish reversal sign. The Relative Strength Index (RSI) has pointed upwards and crossed the neutral point.
Also, the two lines of the Percentage Price Oscillator (PPO) have formed a bullish crossover. It has formed an inverted head-and-shoulders pattern.
Therefore, the pair will likely continue rising as bulls target the key resistance level at 1.3875, its highest point this year. The alternative scenario is where it pulls back and retests the upper side of the falling wedge pattern.