
Bullish view
Buy the GBP/USD pair and set a take-profit at 1.3600.
Add a stop-loss at 1.3350.
Timeline: 1-2 days.
Bearish view
Sell the GBP/USD and set a take-profit at 1.3350.
Add a stop-loss at 1.3600.
The GBP/USD price continued its rally, reaching its highest point since February 26. It jumped to 1.3490, and may be on the verge of more gains after forming a falling wedge and an inverted head-and-shoulders pattern.
US Dollar Drops Despite the Strait of Hormuz Blockade
The GBP/USD pair continued its strong uptrend as the greenback plunged despite the closure of the Strait of Hormuz, which has pushed crude oil prices higher.
In theory, the US dollar should rise when geopolitical tensions rise because of its role as a safe-haven asset. As such, the US dollar weakness is a sign that investors anticipate the ongoing Strait of Hormuz closure as a bargaining chip ahead of the end of the two-week ceasefire.
The GBP/USD pair continued rising after the US published a weak housing report. According to the National Association of Realtors, sales of previously owned US homes dropped to the lowest level since June last year, posing a major challenge as the key spring selling season nears.
Existing home sales dropped by 3.6% in March to 3.98 million, with analysts blaming the rising mortgage rates as bond yields jumped. The ongoing crisis in the Middle East contributed to the slowdown. For example, the country's consumer confidence dropped to the lowest level in years.
The next crucial data to watch will be the upcoming US Producer Price Index (PPI) data. Economists expect the data to show that the figure rose to 4.6% from the previous 3.4%. This inflation report will come a few days after the BLS released the Consumer Price Index (CPI) report, which showed that it jumped to 3.3% in March.
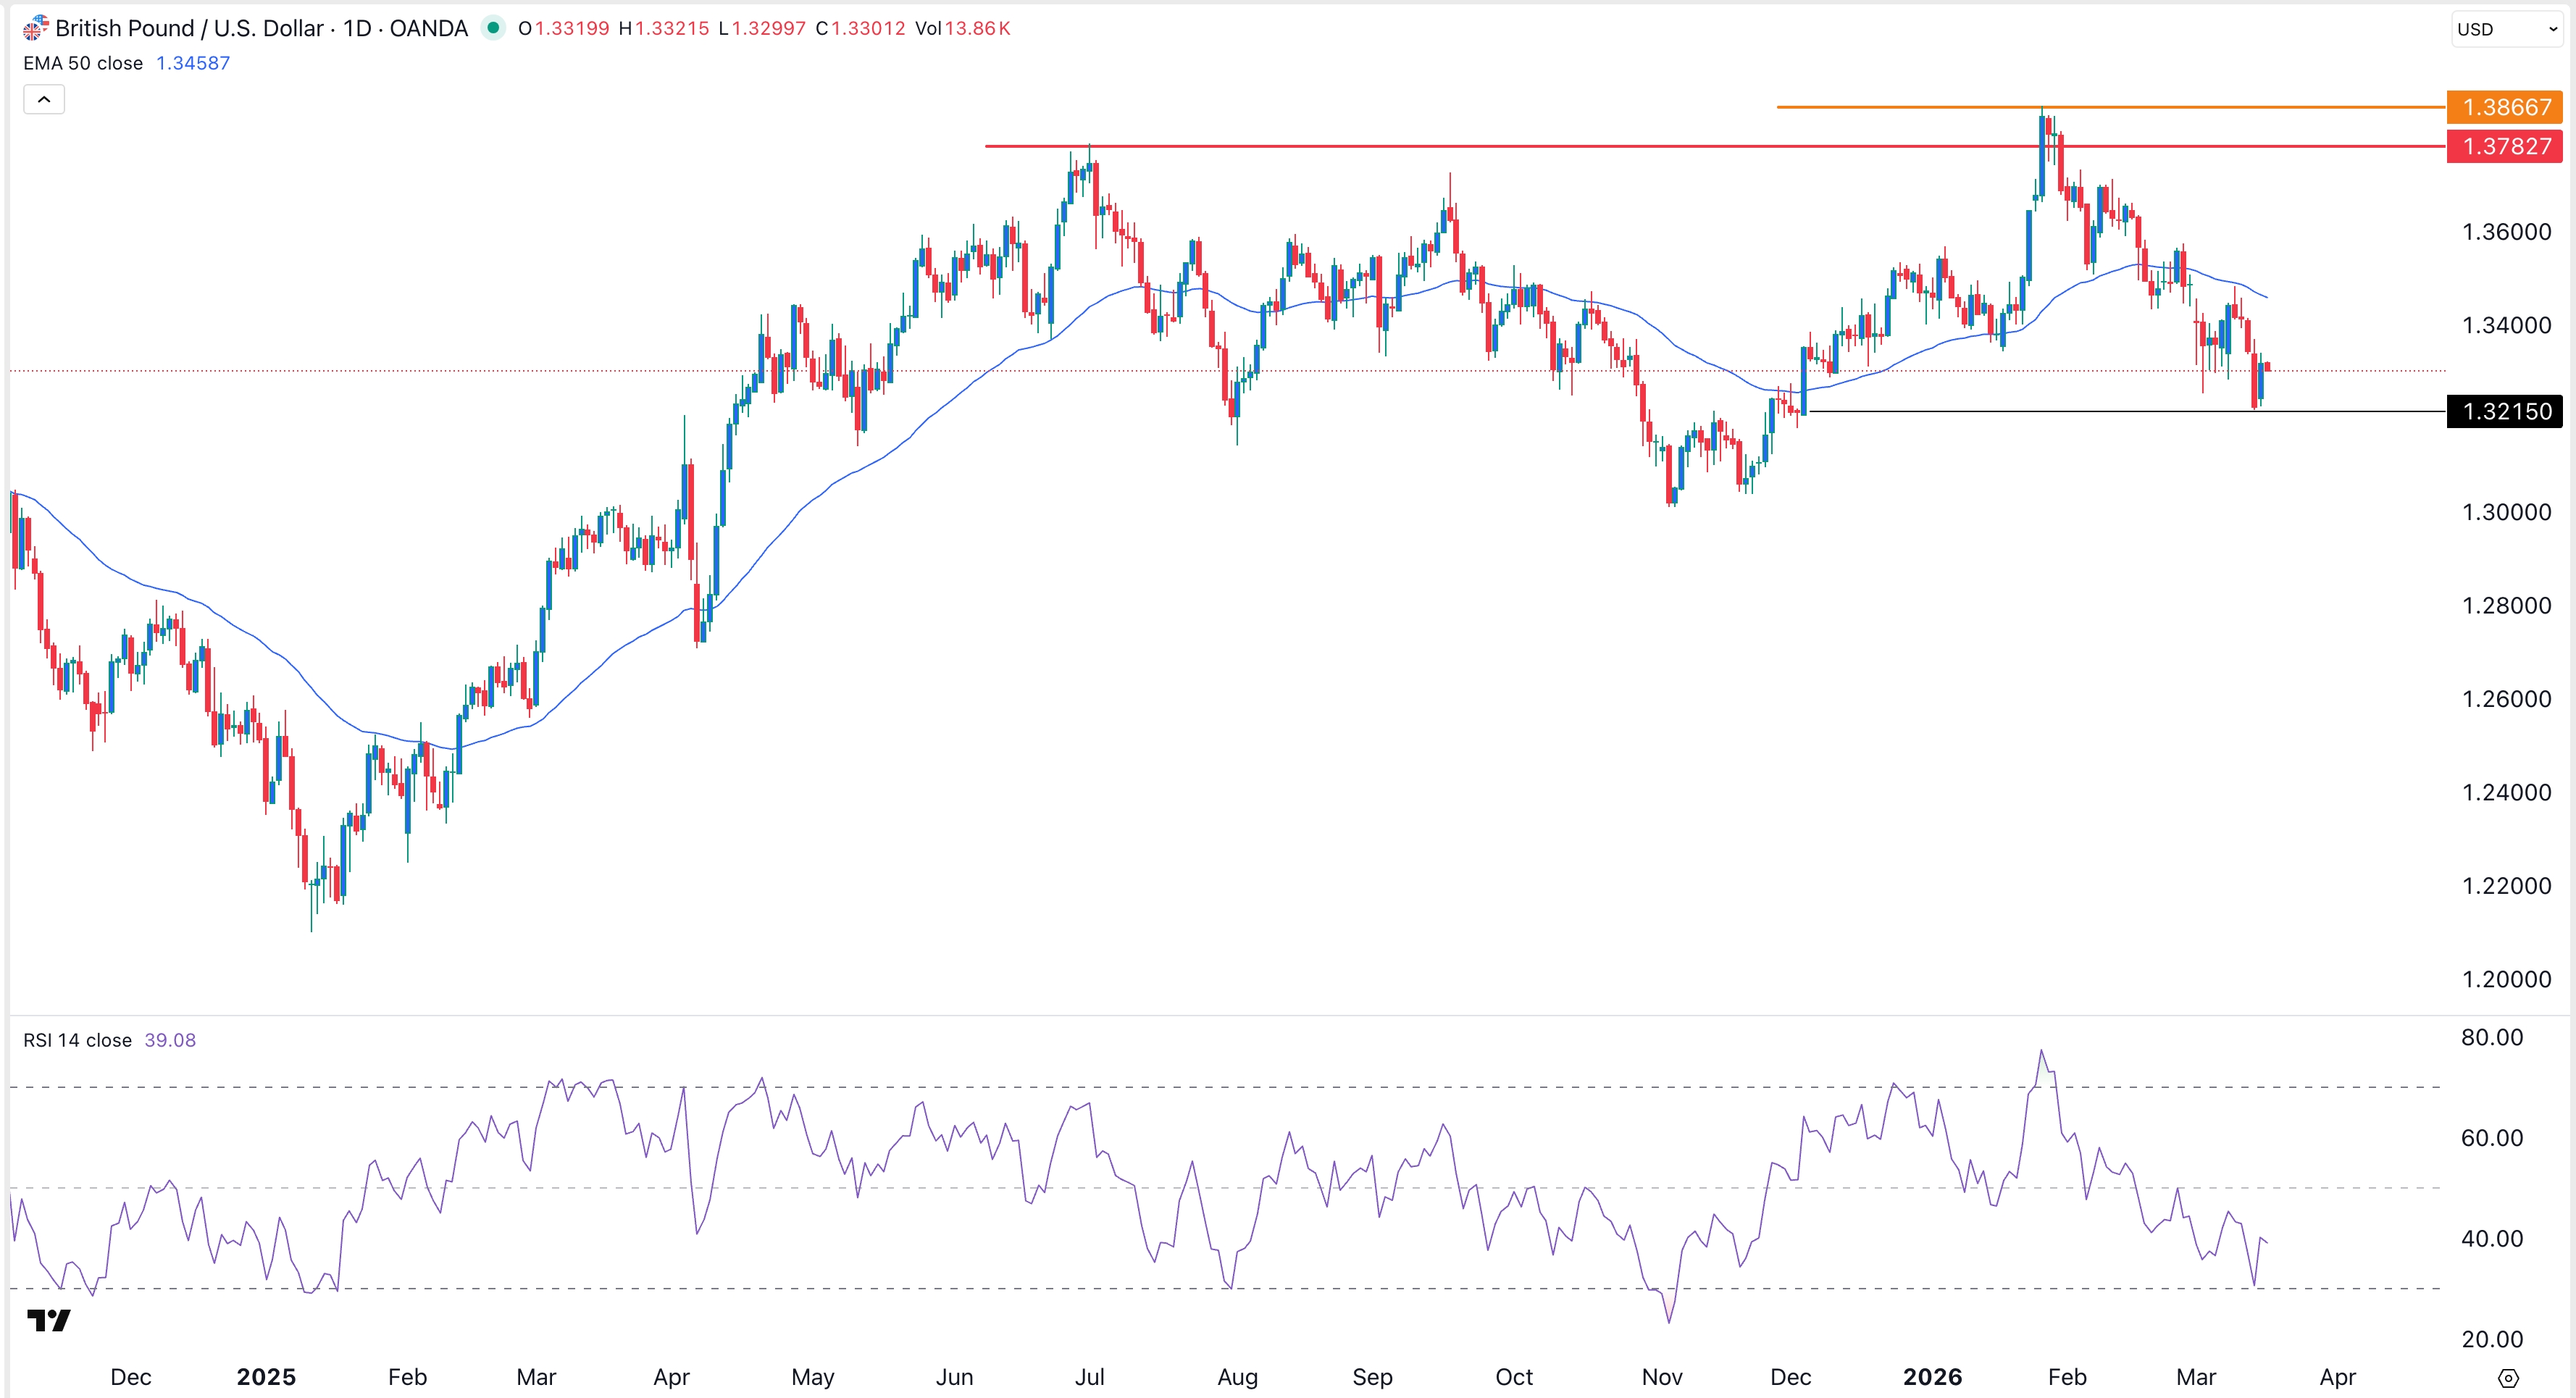
GBP/USD Technical Analysis
The daily timeframe chart shows that the GBP/USD pair have rebounded from a low of 1.3150 on March 31 to a high of 1.3490.
It has formed a falling wedge pattern and has moved above its upper side. It also formed an inverted head-and-shoulders pattern, a common bullish reversal sign in technical analysis.
The histogram of the Percentage Price Oscillator (PPO) moved above the zero line on April 8, while its two lines have crossed each other. Also, the Relative Strength Index (RSI) has jumped and is nearing the overbought level.
The pair has also formed a bullish engulfing pattern, which happens when a large bullish candle follows a smaller one. Therefore, the pair will likely continue rising as bulls target the psychological level at 1.3500.