
Bullish view
Buy the GBP/USD pair and set a take-profit at 1.3600.
Add a stop-loss at 1.3400.
Timeline: 1-2 days.
Bearish view
Sell the GBP/USD pair and set a take-profit at 1.3600.
Add a stop-loss at 1.3400.
The GBP/USD exchange rate pulled back on Thursday as traders reacted to the ongoing US-Iran crisis and the latest UK consumer inflation report. It dropped to a low of 1.3500, down from this month's high of 1.3570.
UK Inflation Jumps as US-Iran Continues
The GBP/USD pair remained under pressure this week as the US-Iran war continued. In a statement on Tuesday, President Donald Trump said that he was extending the ceasefire after the other one ended.
This happened after the Iranians signaled that they were not going to Pakistan for the talks. As a result, crude oil prices have continued rising as the Strait of Hormuz remains closed. Iran has also attacked and taken ships attempting to cross the Strait.
This war has led to higher inflation in the UK and the US. In a report on Wednesday, the headline consumer price index rose from 3% in February to 3.3% in March. Core inflation, which excludes the volatile food and energy prices, slowed to 3.1%.
These numbers mean that the Bank of England (BoE) will maintain interest rates unchanged in the coming months, with some analysts expecting it to maintain them intact for the rest of the year.
The next key catalyst to watch will be the upcoming UK and US manufacturing and services PMI numbers. Economists polled by Reuters expect the upcoming report to show that the manufacturing PMI dropped from 51 in March to 49.9, while the services figure dropped from 50.5 to 50.
On the other hand, in the US, analysts expect the upcoming report to show that the manufacturing PMI rose from 52.3 to 52.5 in April, while the services figure rose from 49.8 to 50.
AUD/USD Technical Analysis
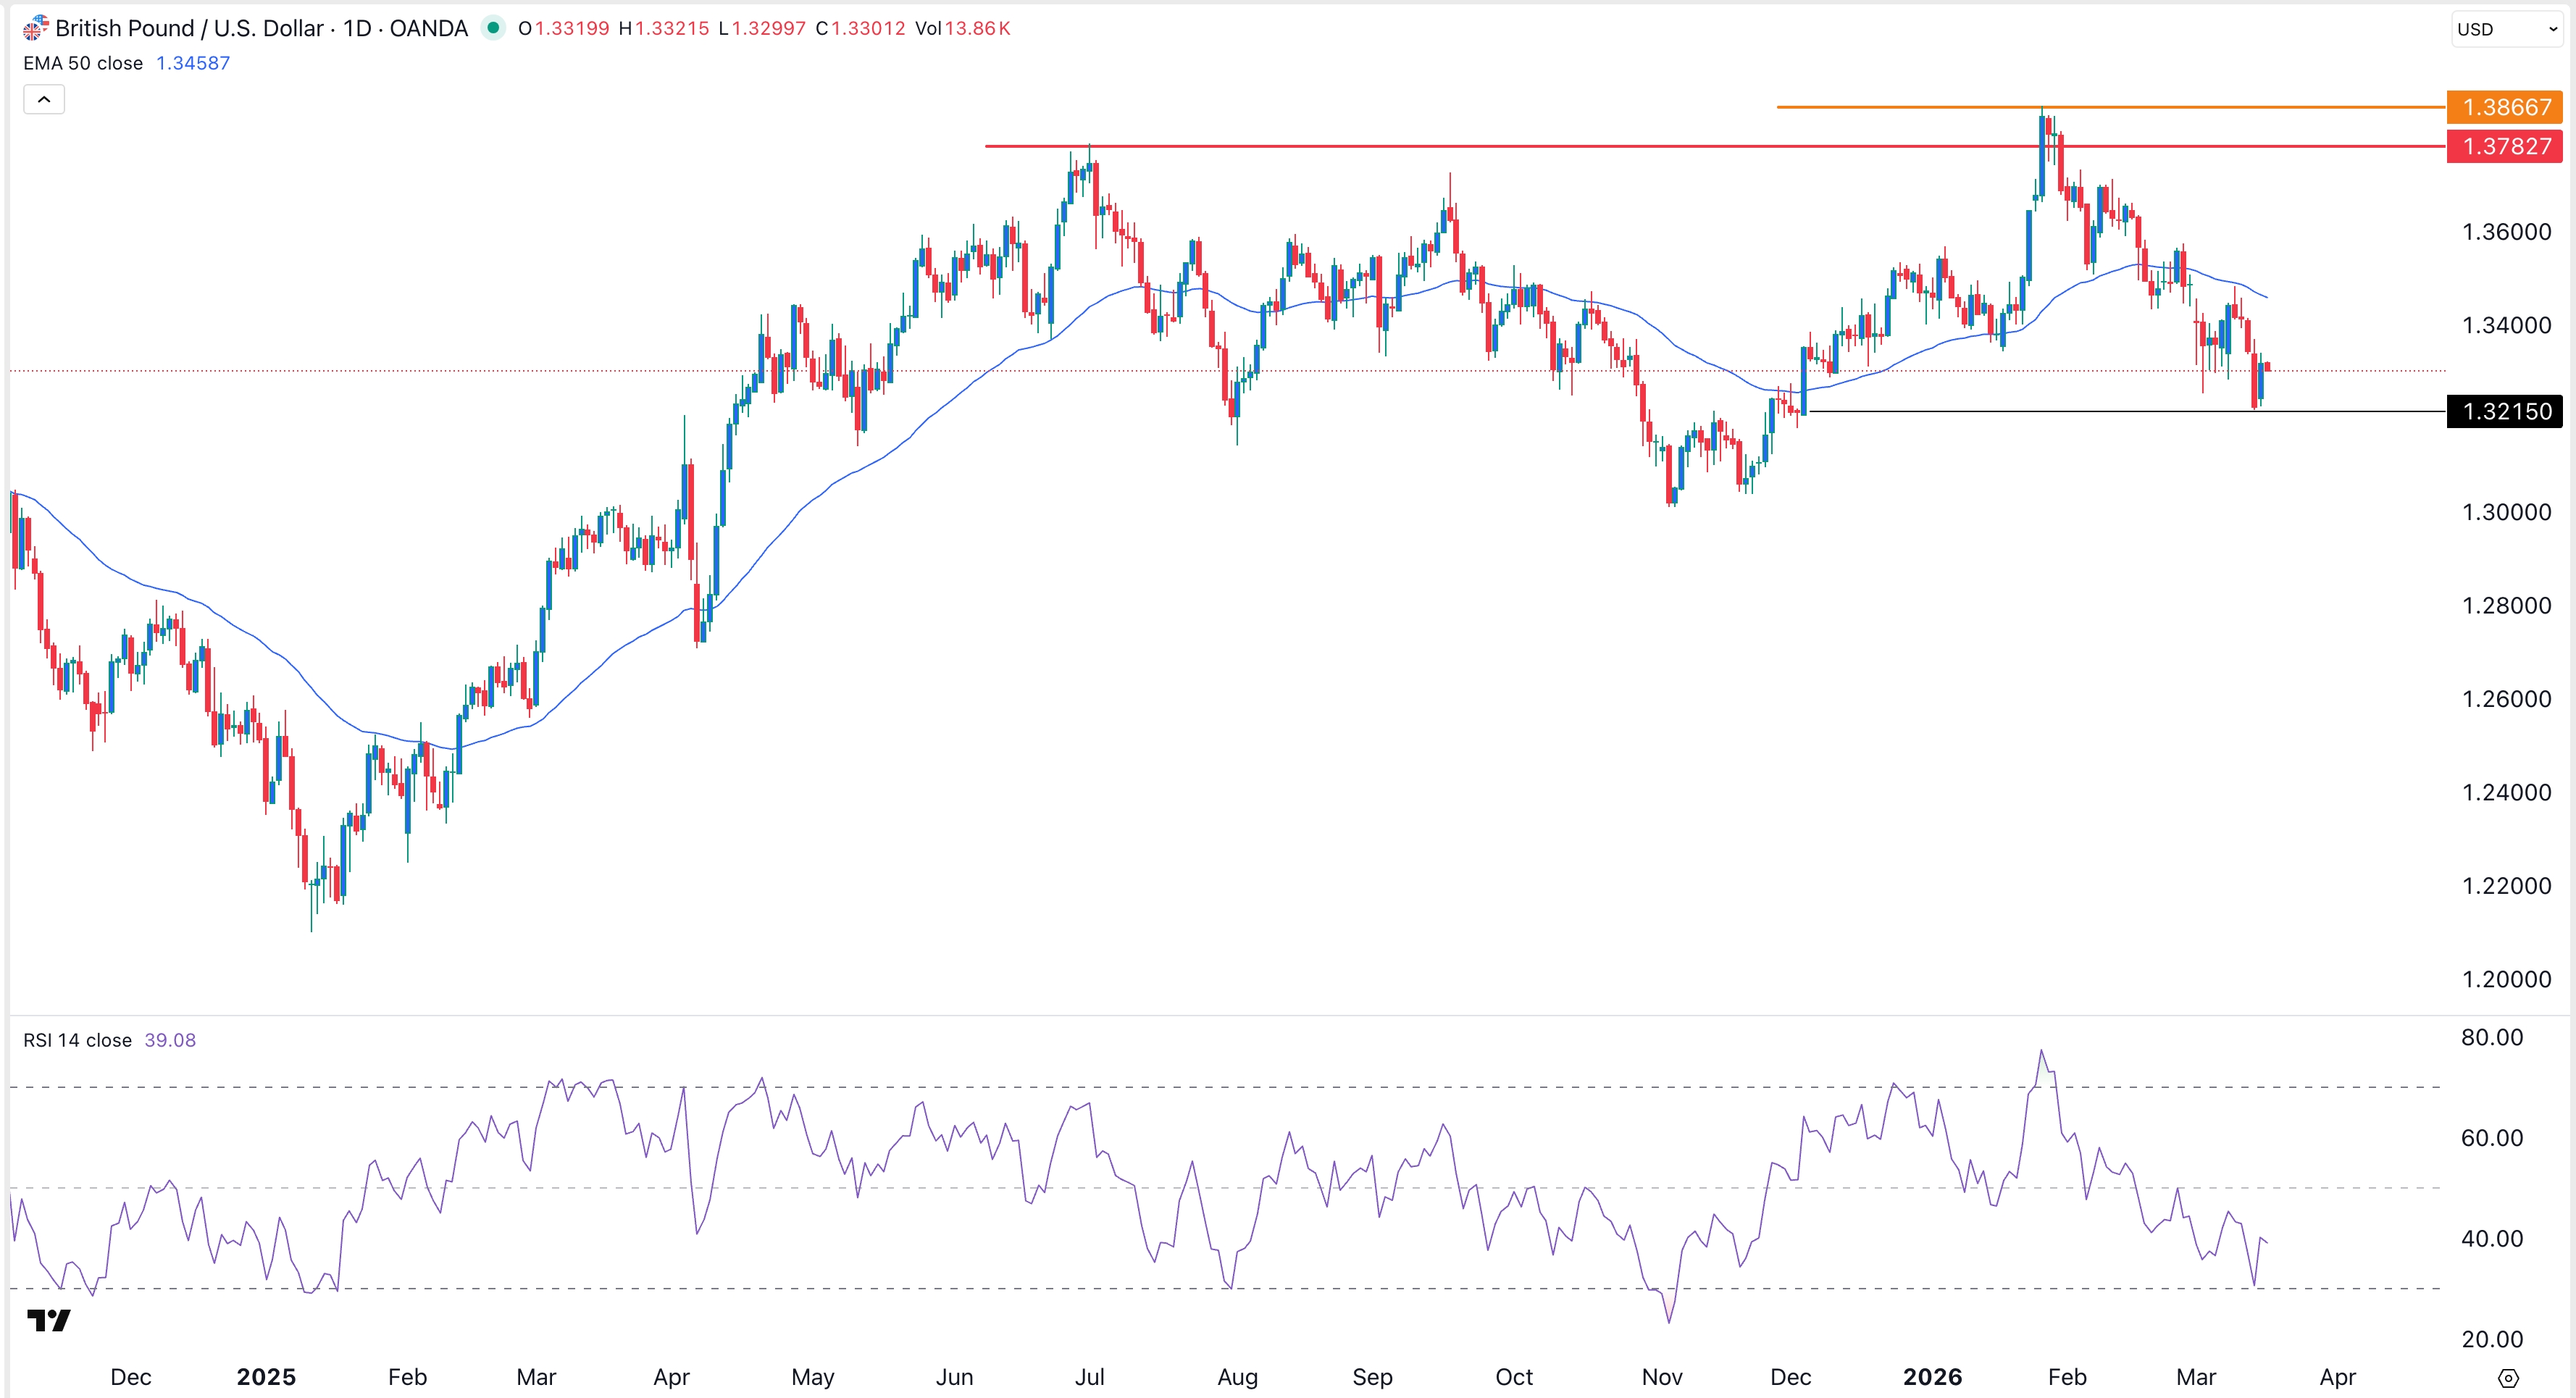
The daily timeframe chart shows that the GBP/USD pair has rebounded in the past few months, moving from a low of 1.3162 in March to a high of 1.3596 last week.
It has dropped and retested the important support level at 1.3475, its highest point on March 10 and March 23. A break-and-retest pattern normally leads to more gains.
The pair has moved above the 50-day and 100-day Exponential Moving Averages (EMA). It has formed an inverted head-and-shoulders pattern, which is a common bullish reversal sign in technical analysis.
Therefore, the pair will likely continue rising, with the next key target being this month’s high of 1.3595. A move above that level will point to more gains, potentially to 1.3600.