
Bearish view
Sell the EUR/USD pair and set a take-profit at 1.1415.
Add a stop-loss at 1.1650.
Timeline: 1-2 days.
Bullish view
Buy the EUR/USD pair and set a take-profit at 1.1650.
Add a stop-loss at 1.1415.
The EUR/USD exchange rate has remained inside a narrow range in the past few weeks as the Iranian war continued. It was trading at 1.1545 on Tuesday as traders waited for Donald Trump's deadline on bombing Iran's critical infrastructure.
Focus on Geopolitical Tensions
The EUR/USD exchange rate was trading in a narrow range on Tuesday as traders waited for more details on Trump's attack on Iran’s critical infrastructure like bridges and power plants, a move meant to pressure its leaders to reach a deal to reopen the Strait of Hormuz.
Iran has threatened to intensify its attacks against Israel and critical infrastructure of its neighboring countries like Saudi Arabia and the United Arab Emirates. It has also pledged to blast Arabian oil and gas plants, a move that will lead to higher crude oil prices.
Data shows that the West Texas Intermediate (WTI) rose to $112.50, while Brent rose to $110, an uptrend that may continue in the foreseeable future, especially if the attacks intensify. These actions will work counter to Trump's goal of bringing gasoline and diesel prices lower.
The EUR/USD pair reacted to the latest US non-manufacturing PMI report, which showed that the services sector slowed in March as the war continued. It dropped to 54 from the previous 56.1.
The other key catalyst for the pair will be the upcoming European services PMI, which will come out as most countries reopen after the Easter holiday. Economists expect the data to show that the European services PMI dropped to 50.5 from the previous 51.9.
The pair will also react to the upcoming US durable goods orders followed by the Federal Reserve minutes on Wednesday. These minutes will provide more information about what officials deliberated in the last meeting.
EUR/USD Technical Analysis
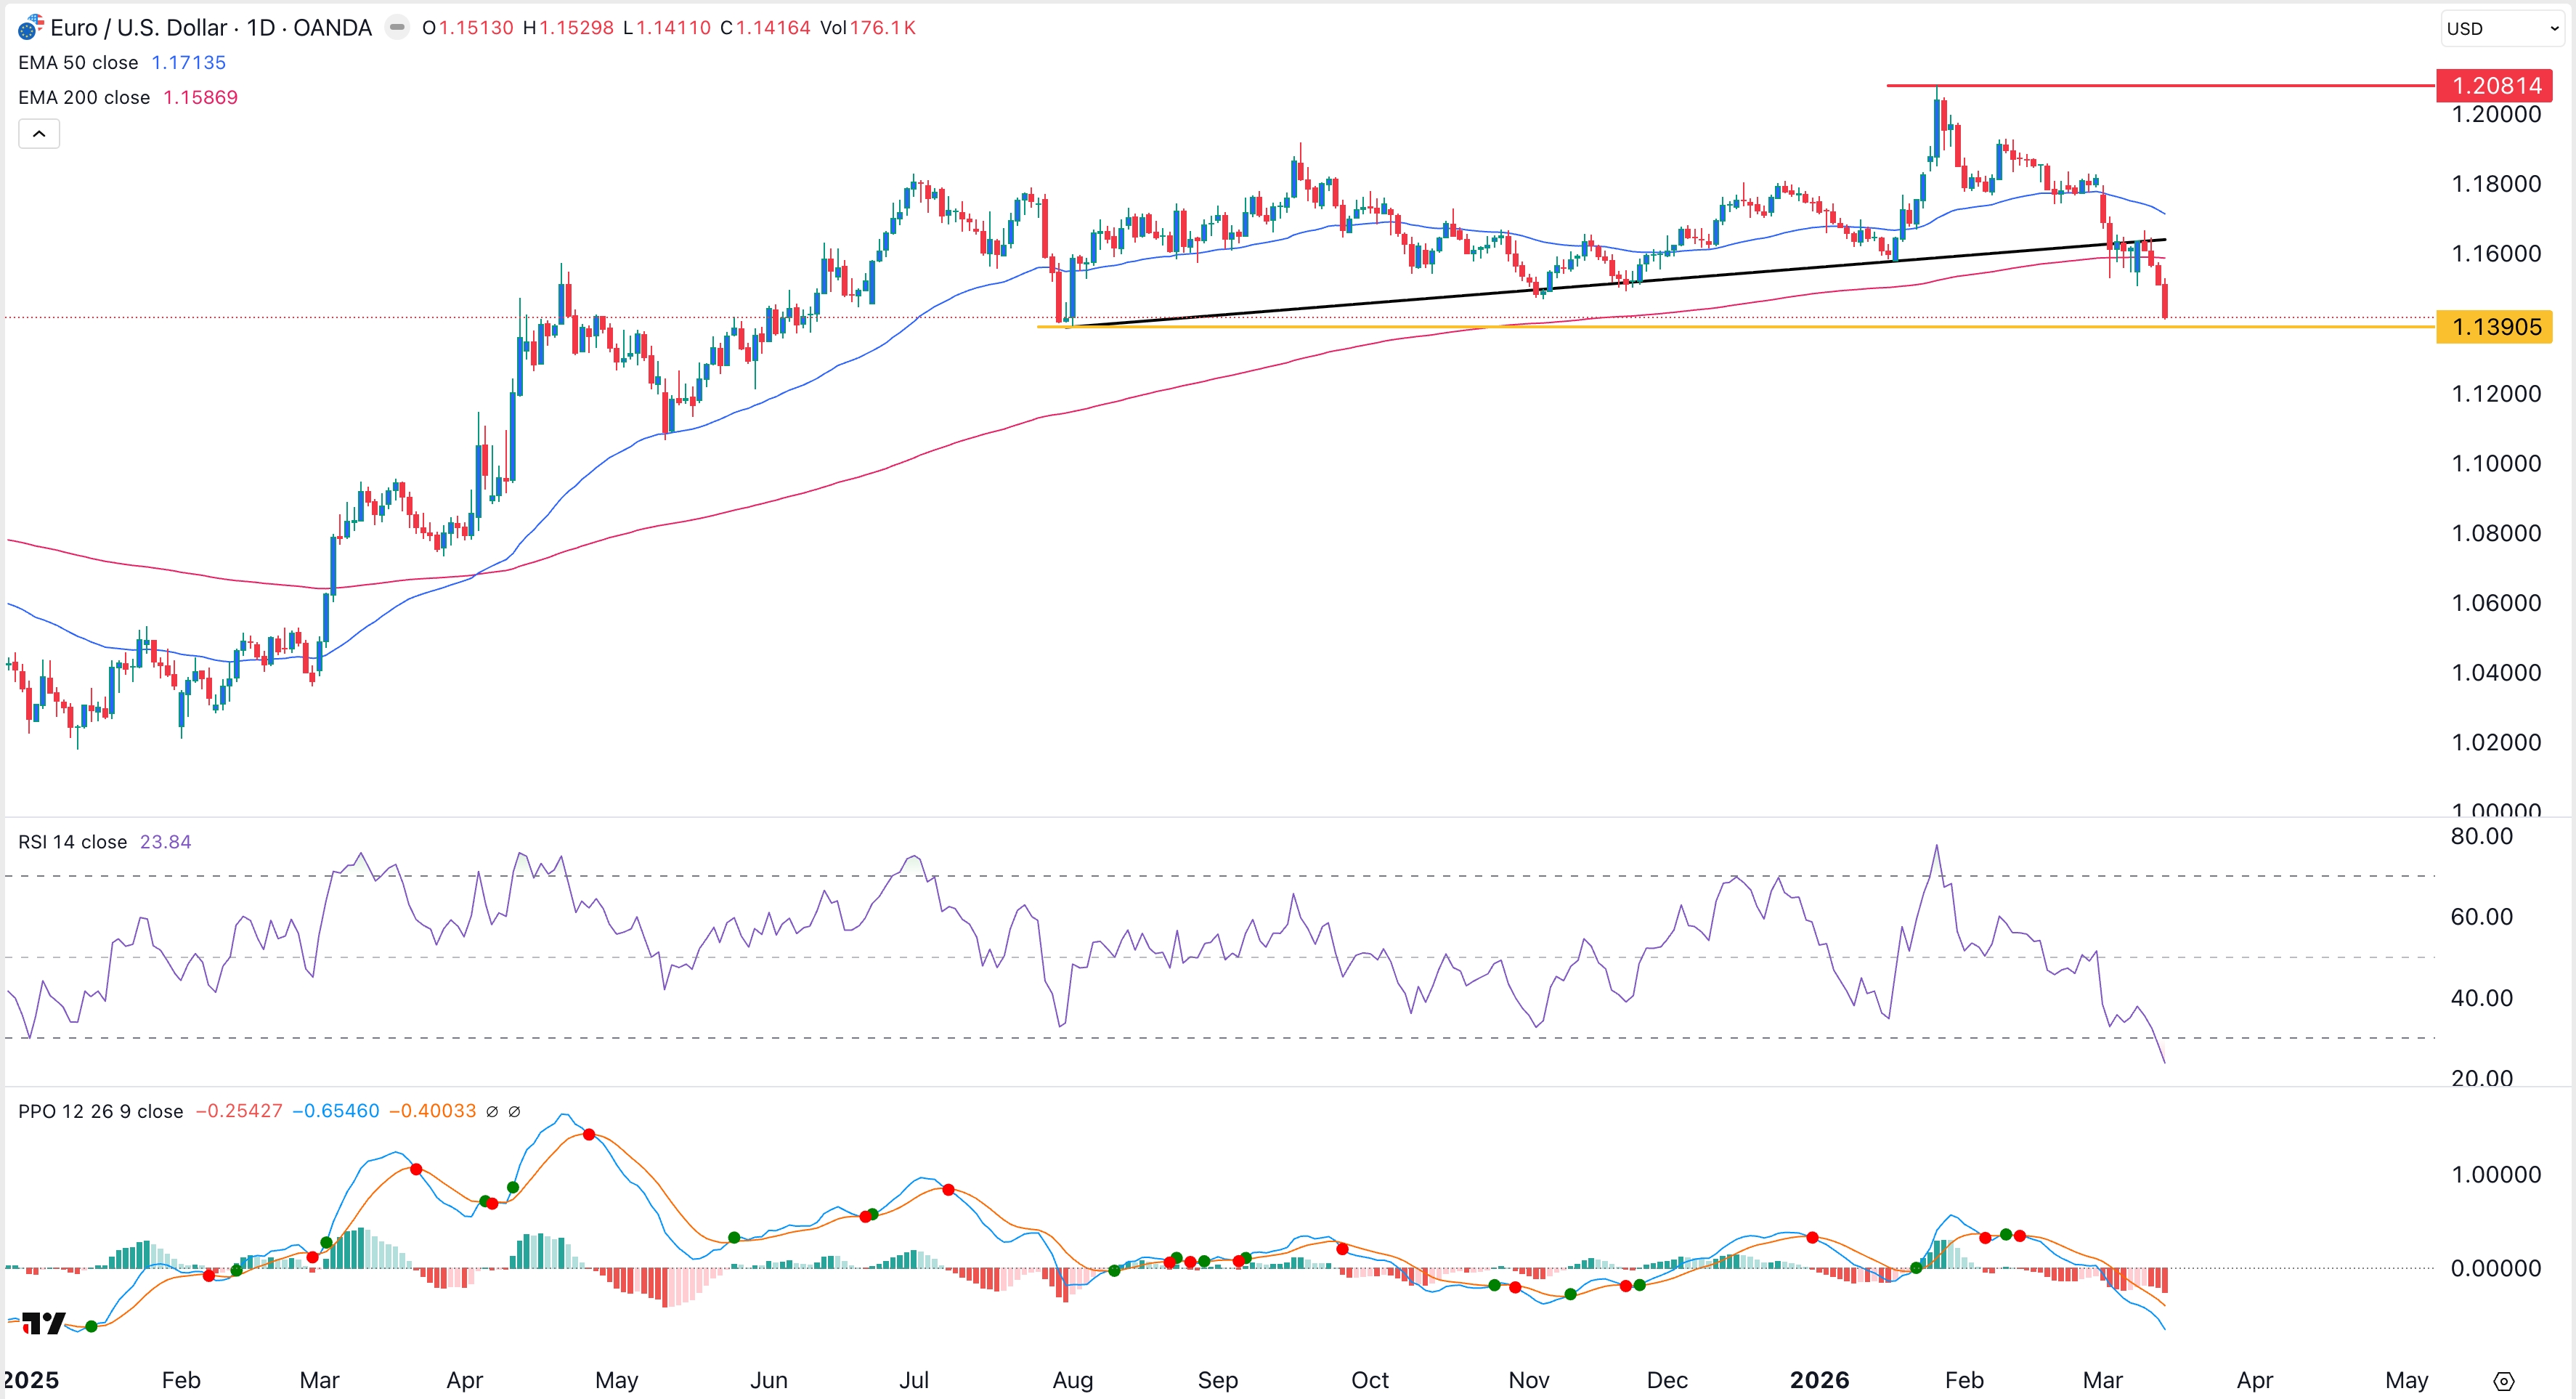
The daily timeframe chart shows that the EUR/USD exchange rate has remained in a narrow range in the past few weeks. It was trading at 1.1542 on Tuesday, down sharply from the year-to-date high of 1.2081.
The pair has remained below the 50-day and 100-day Exponential Moving Averages (EMA), which formed a mini death cross pattern in March this year.
It has formed a bearish pennant pattern, which is made up of a vertical line and a symmetrical triangle pattern. The two lines of this triangle are nearing their confluence, a sign that a bearish breakdown may happen soon.
If this happens, the next key target to watch will be at 1.1413, its lowest level this year. A move above the key resistance level at 1.1600 will invalidate the bearish outlook.