
Bullish view
Buy the EUR/USD pair and set a take-profit at 1.2000.
Add a stop-loss at 1.1600.
Timeline: 1-2 days.
Bearish view
Sell the EUR/USD pair and set a take-profit at 1.1600.
Add a stop-loss at 1.2000.
The EUR/USD exchange rate rose to its highest level since March 2nd, even as the US started its naval blockade against Iran. It jumped to a high of 1.1740, up sharply from the year-to-date low of 1.1413. It will react to the upcoming US Producer Price Index (PPI) data.
US PPI Data and US Blockade of the Strait of Hormuz
The EUR/USD pair has been in a strong rebound in the past few weeks. This rebound continued even after the US started blockading the Strait of Hormuz, a major chokepoint in the Middle East.
The blockade has pushed crude oil prices higher, with the West Texas Intermediate (WTI) and Brent jumping to over $100. Analysts warn that the real prices are much higher as the global supply squeeze continues.
At the same time, there is a possibility that Iran will retaliate, including by launching attacks on ports from other countries in the Middle East. Also, experts believe that the ceasefire may end, which will lead to more fighting and higher oil prices.
The next key catalyst for the pair will be the upcoming Producer Price Index (PPI) report later today. Economists expect the data to show that the headline PPI rose from 3.4% in February to 4.6% in March as energy prices jumped.
A report released on Friday showed that the headline Consumer Price Index (CPI) rose from 2.4% to 3.3%, while the core CPI rose to 2.7%.
The pair will also react to the upcoming statements by key officials, including Federal Reserve’s Austan Goolsbee, Michael Barr, and Susan Collins. Some European Central Bank (ECB) members like Philip Lane and Piero Cipollone.
EUR/USD Technical Analysis
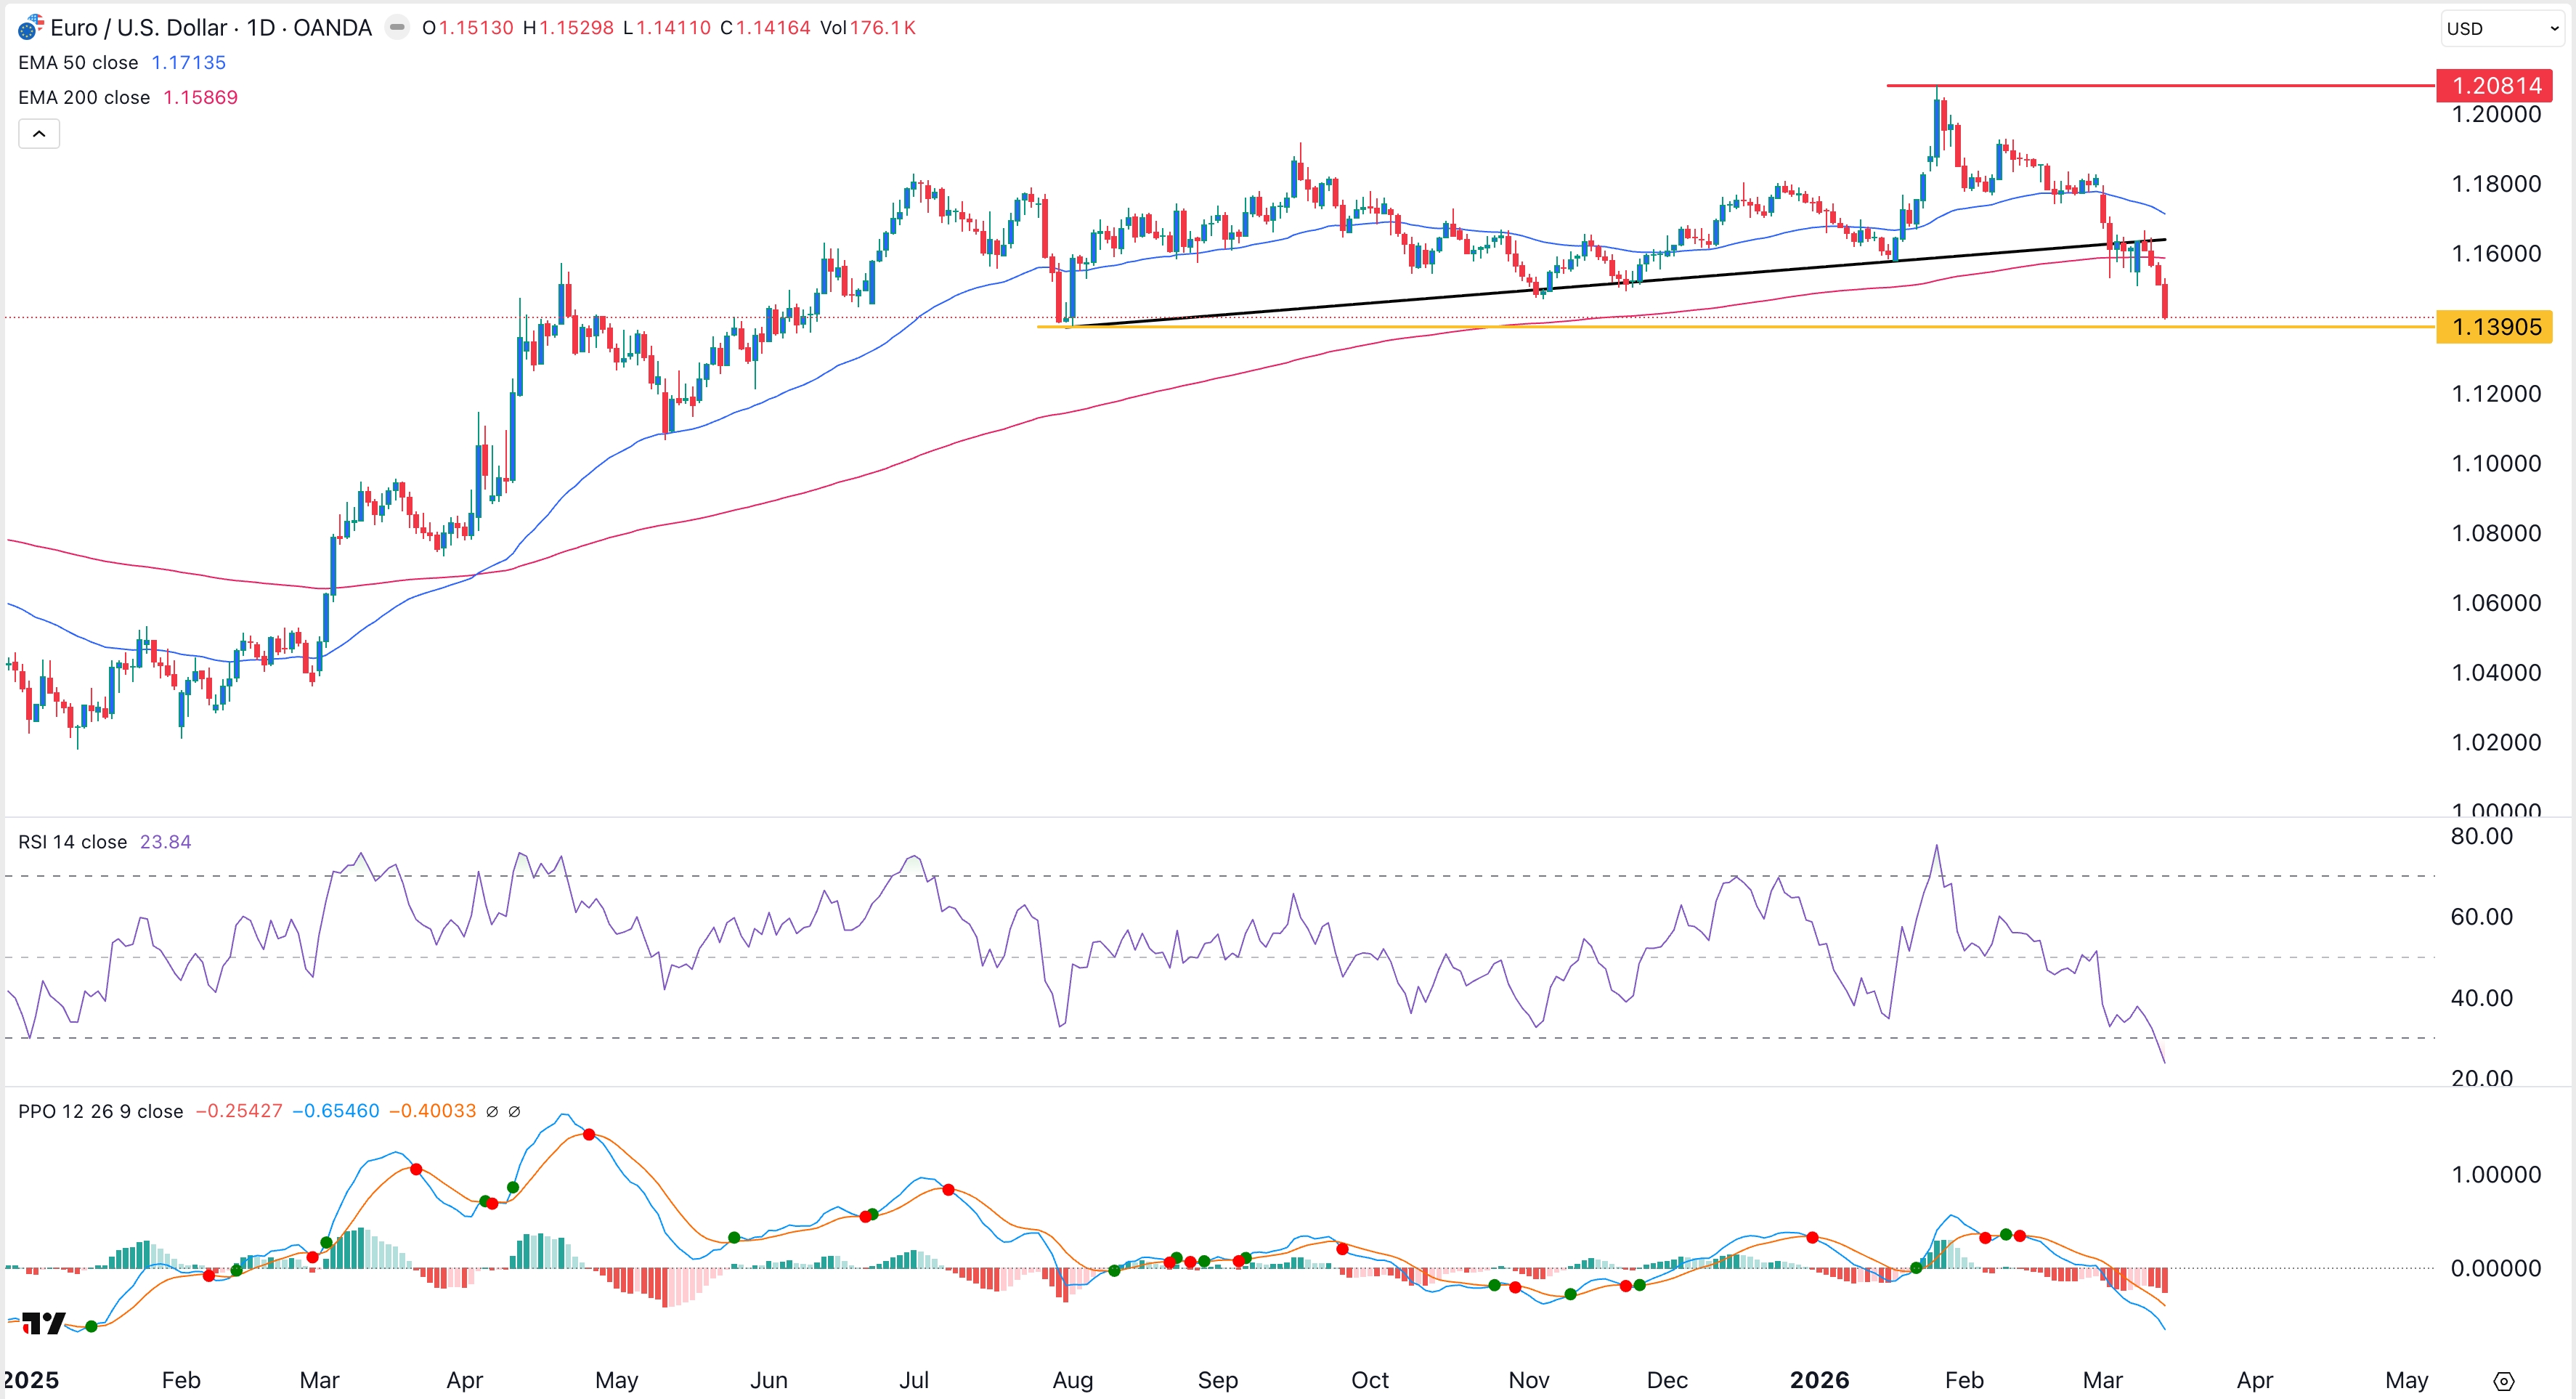
The daily chart shows that the EUR/USD pair has jumped to 1.1735, its highest point since March 2nd. This rebound happened after forming a double-bottom pattern whose neckline was at 1.1640, its highest point on March 23.
The pair has jumped above the 50-day Exponential Moving Average (EMA) and has formed a bullish engulfing pattern. The Percentage Price Oscillator (PPO) and the Relative Vigor Index (RVI) have formed a bullish crossover pattern.
Therefore, the pair will likely continue rising as bulls target the psychological level at 1.2000. On the other hand, a drop below the key support level at 1.1600 will invalidate the bullish outlook.