
Ethereum soared 9.5% in the past 24 hours to trade as high as $2,395 on Tuesday, reclaiming momentum and outpacing Bitcoin as the crypto market shakes off recent volatility.
Ethereum’s bullish breakout, fueled by easing geopolitical tensions and strong institutional signals, raises fresh questions about how far ETH can climb in the remainder of April.
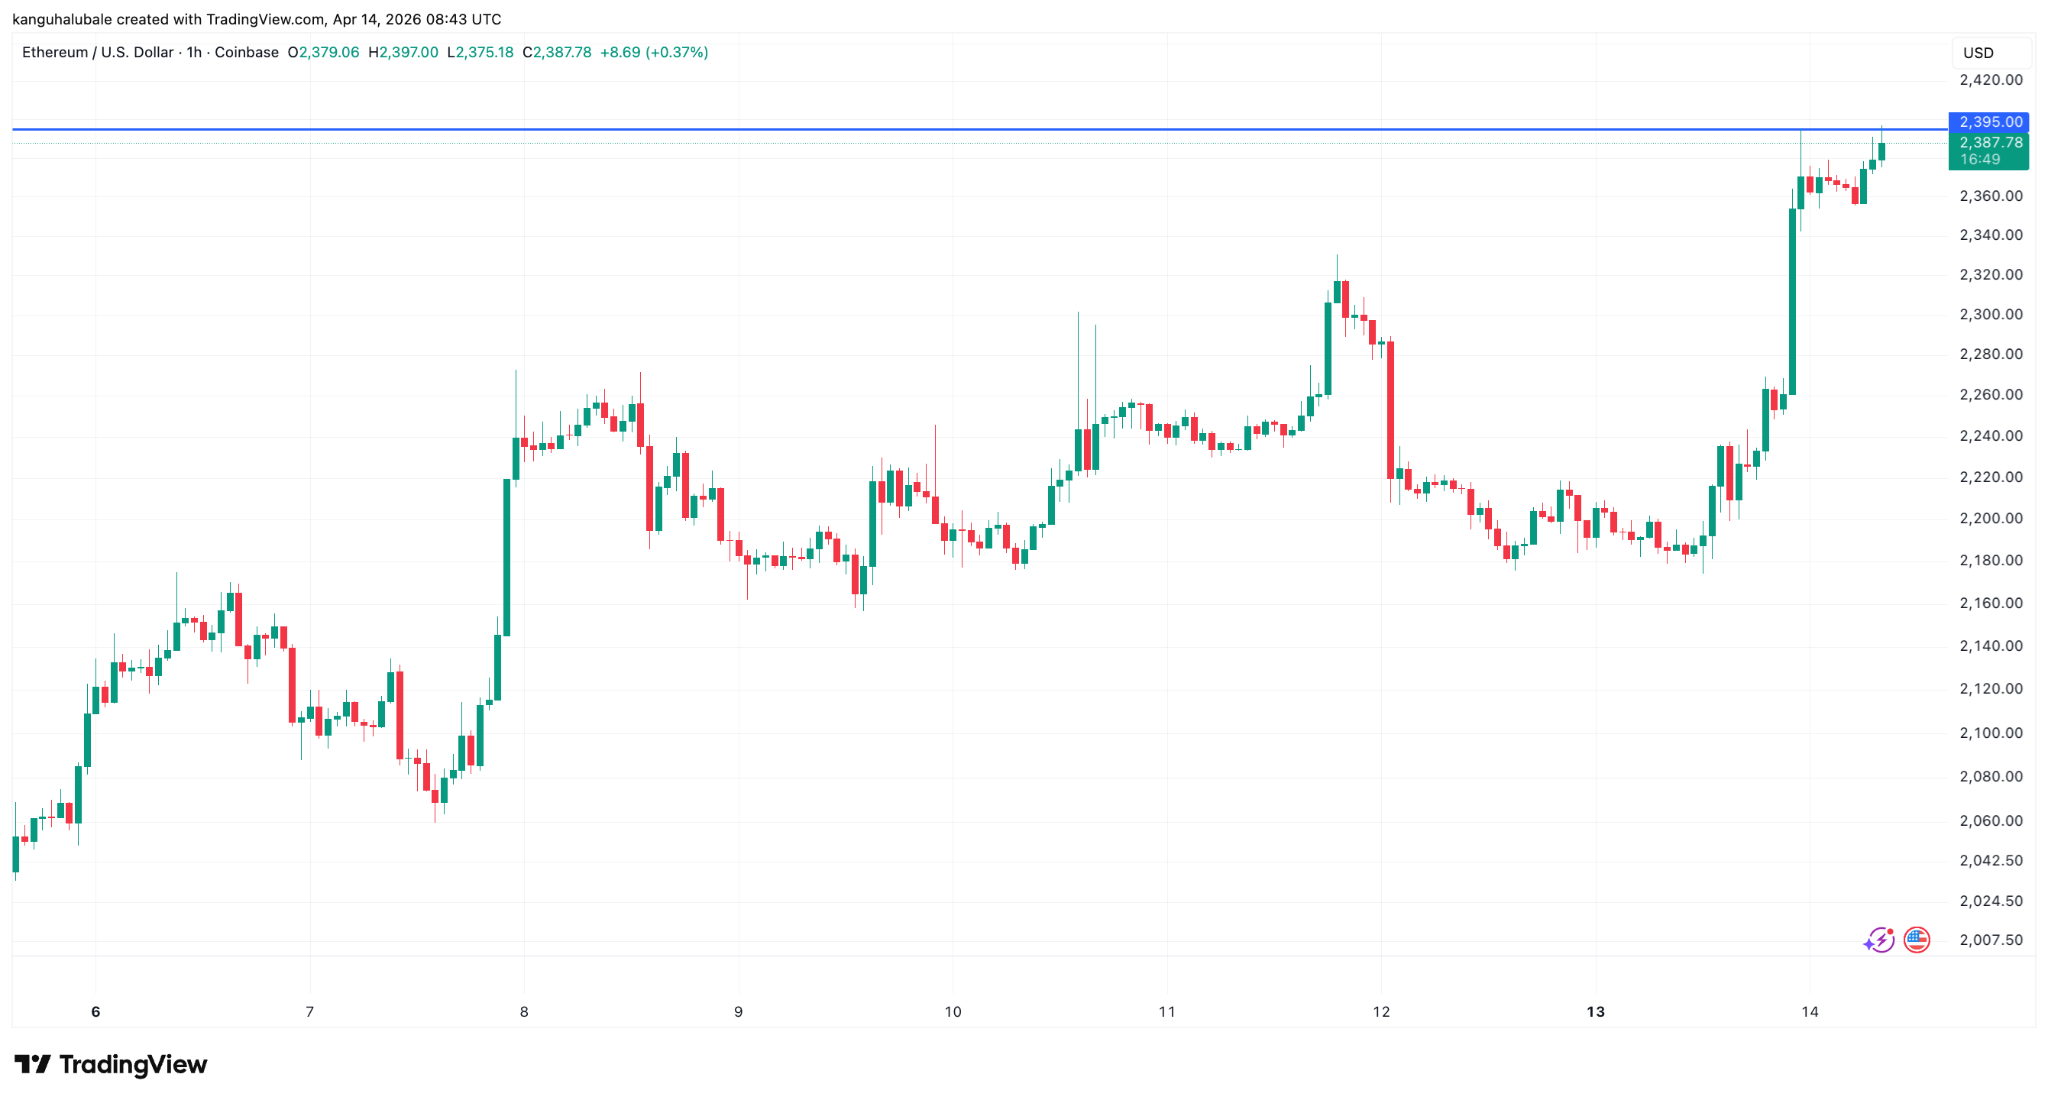
ETH/USD one-hour chart. Source: TradingView
Ether Recovers in Tandem with the Wider Crypto Market
The ETH/USD pair rose above $2,390 on April 14, leading a broad-based recovery across major cryptocurrencies. Ether was also among the best performers in the weekly timeframe, with 13% gains over the last seven days.
Bitcoin (BTC), the market leader, was trading at $74,738 at time of writing, up 5.8% on the day and 8.5% over the last seven days. Fourth-placed XRP (XRP) has gained more than 3.7% over the last day to trade just above $1.37. Solana (SOL) has also posted significant gains among the top 10 cryptocurrencies, up 5.3% on the day and 7.5% over the last week.
As a result, the global crypto market capitalization is up 4.5% over the last 24 hours to rest at $2.52 trillion on Tuesday.
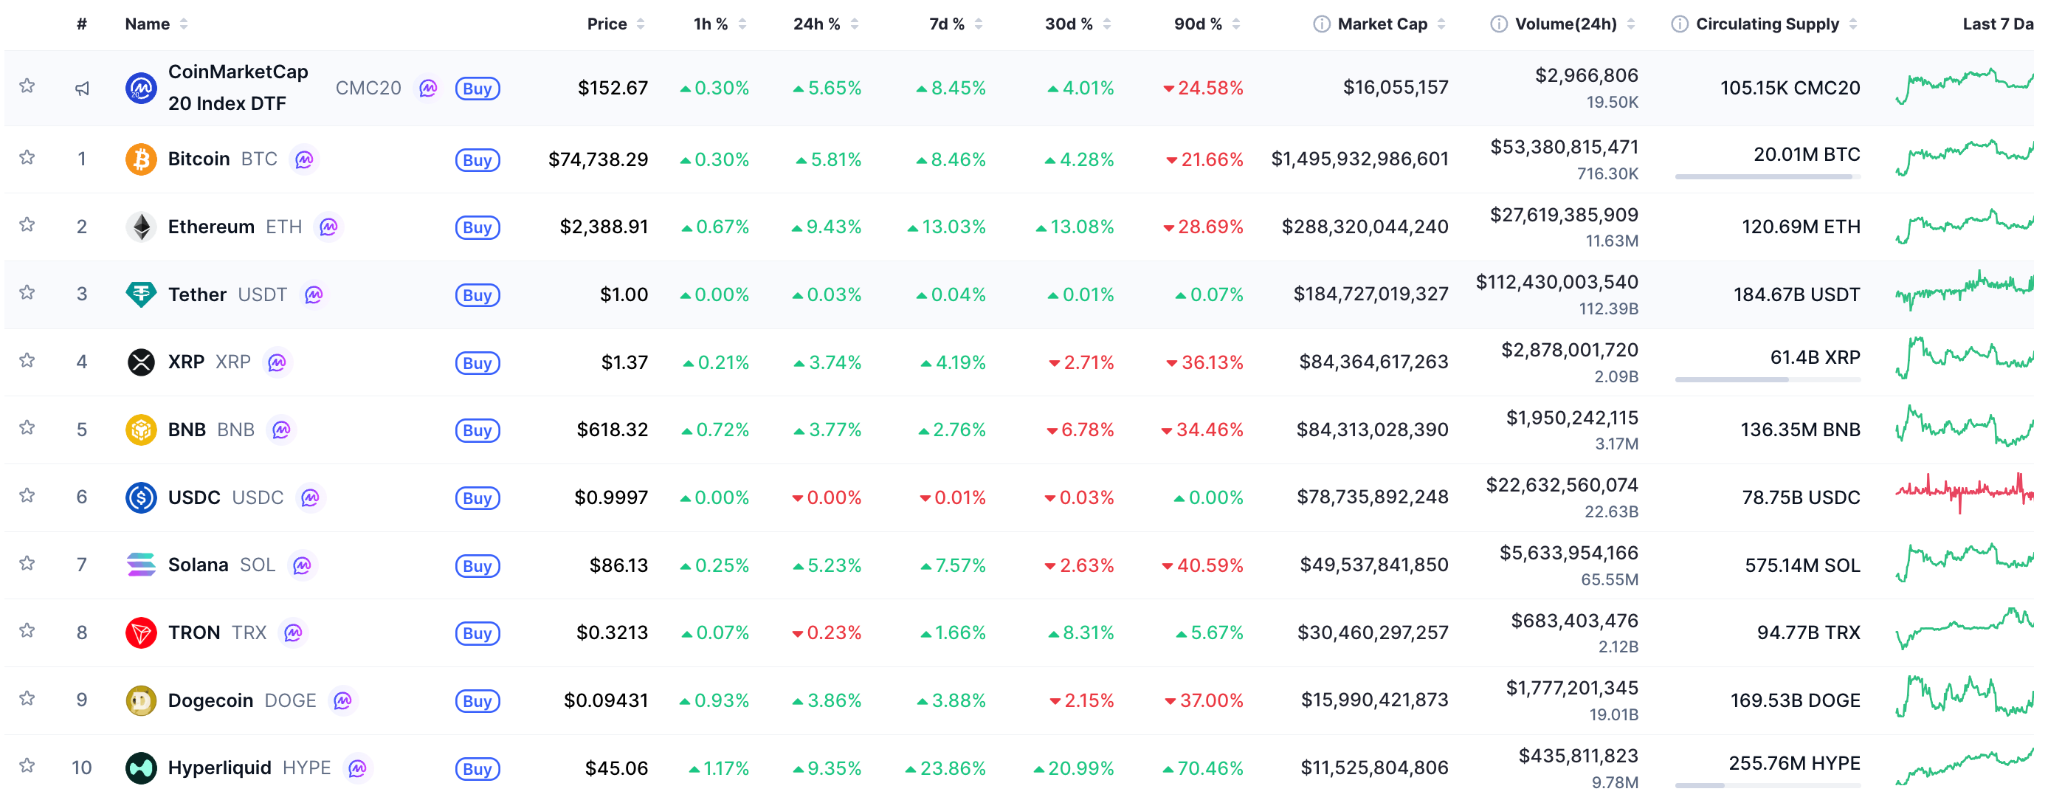
Performance of top-cap cryptocurrencies: Source: CoinMarketCap
Derivatives markets amplified the surge. Over $540 million in futures positions were liquidated in the past 24 hours, with Ethereum alone seeing $142 million wiped out, with short ETH positions accounting for $123 million (86%). This cascade of forced covering accelerated price momentum. 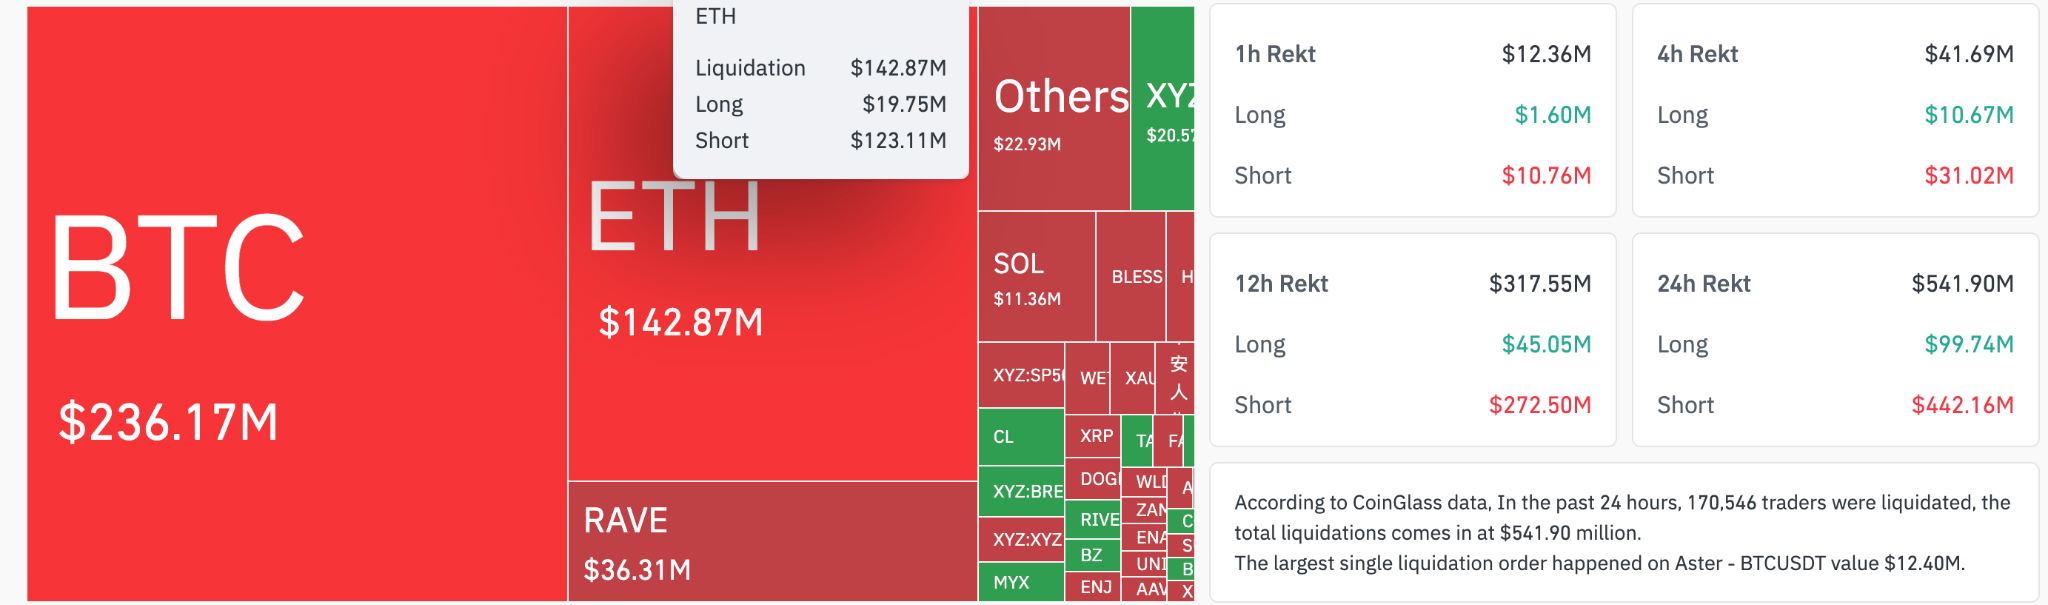
Total 24-hour crypto market liquidations. Source: CoinGlass
At the same time, Ethereum’s open interest jumped sharply, with USD-denominated OI rising by approximately 20% over the last 24 hours to $35.66 billion in a single session, the highest since December 2025. Crucially, coin-denominated open interest also expanded to a nine-month high of 14.96 million ETH, confirming fresh long positioning rather than mere short squeezes.
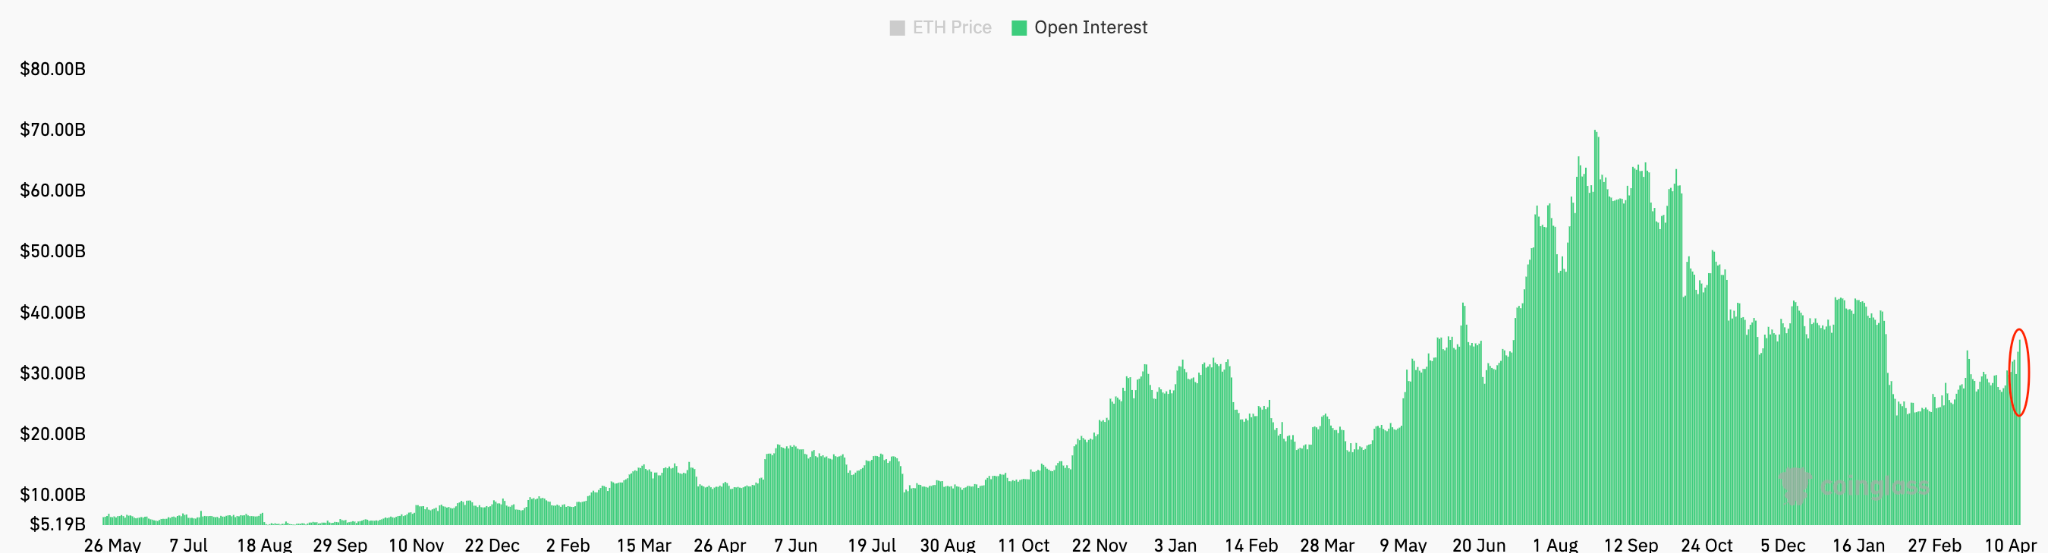
ETH futures open interest. Source: CoinGlass
Ether’s price reacted to news of a US-Iran ceasefire announcement that eased war fears, sparking a risk-on rally in global equities and digital assets alike. Traders who had bet against the market were caught offside, triggering the liquidation wave and allowing Ethereum to lead the charge higher.
Inflows Into Spot Ethereum ETFs Support ETH Price Upside
Monday’s ETF flows provided further evidence of a tactical shift. Spot Ethereum ETFs recorded $9.5 million in net inflows while Bitcoin ETFs posted outflows totaling $281 million. This highlighted early signs of capital rotation from the market leader into high-beta altcoins. This divergence underscores growing investor conviction that Ethereum’s upcoming upgrades and ecosystem developments could deliver outsized returns.
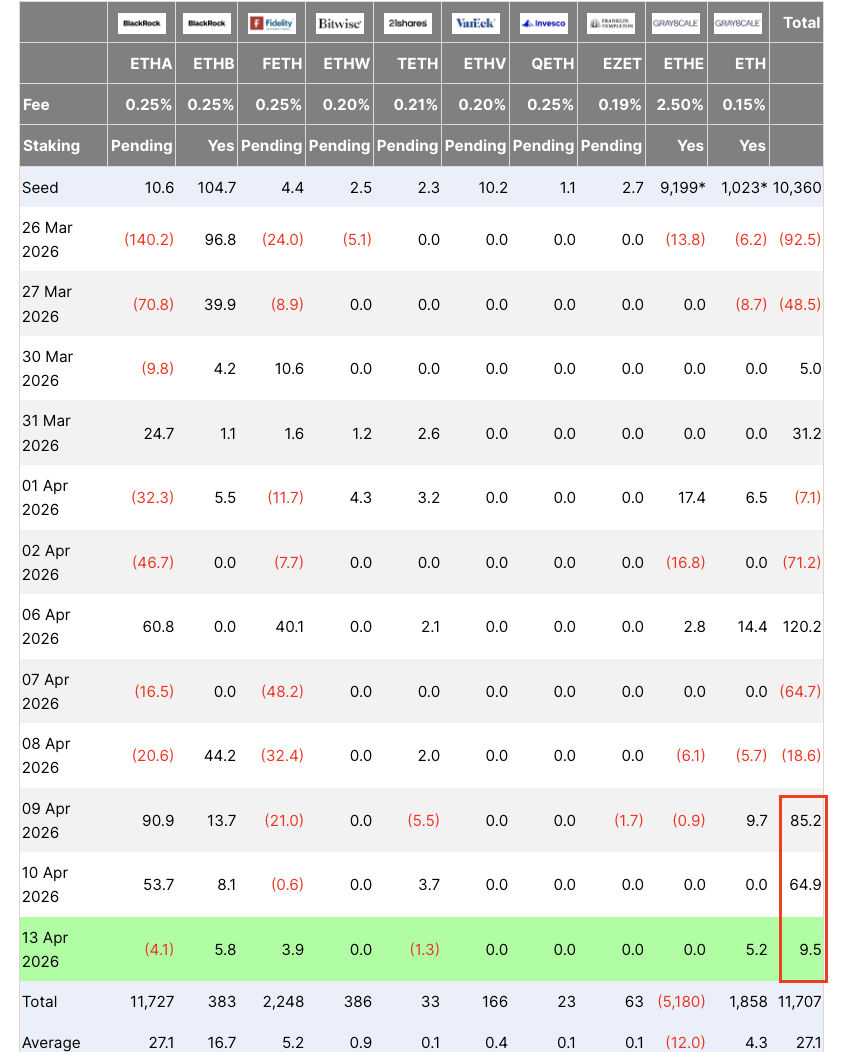
Spot Ethereum ETF flows table. Source: Farside Investors
Compounding the bullish setup is aggressive accumulation by large holders. Onchain data shows whales steadily adding to positions amid the dip.
Most notably, BitMine Immersion Technologies, chaired by Fundstrat’s Tom Lee, has continued its record buying spree, acquiring tens of thousands of ETH in recent weeks and pushing its total holdings above 4.5 million tokens, equivalent to nearly 4% of the circulating supply.
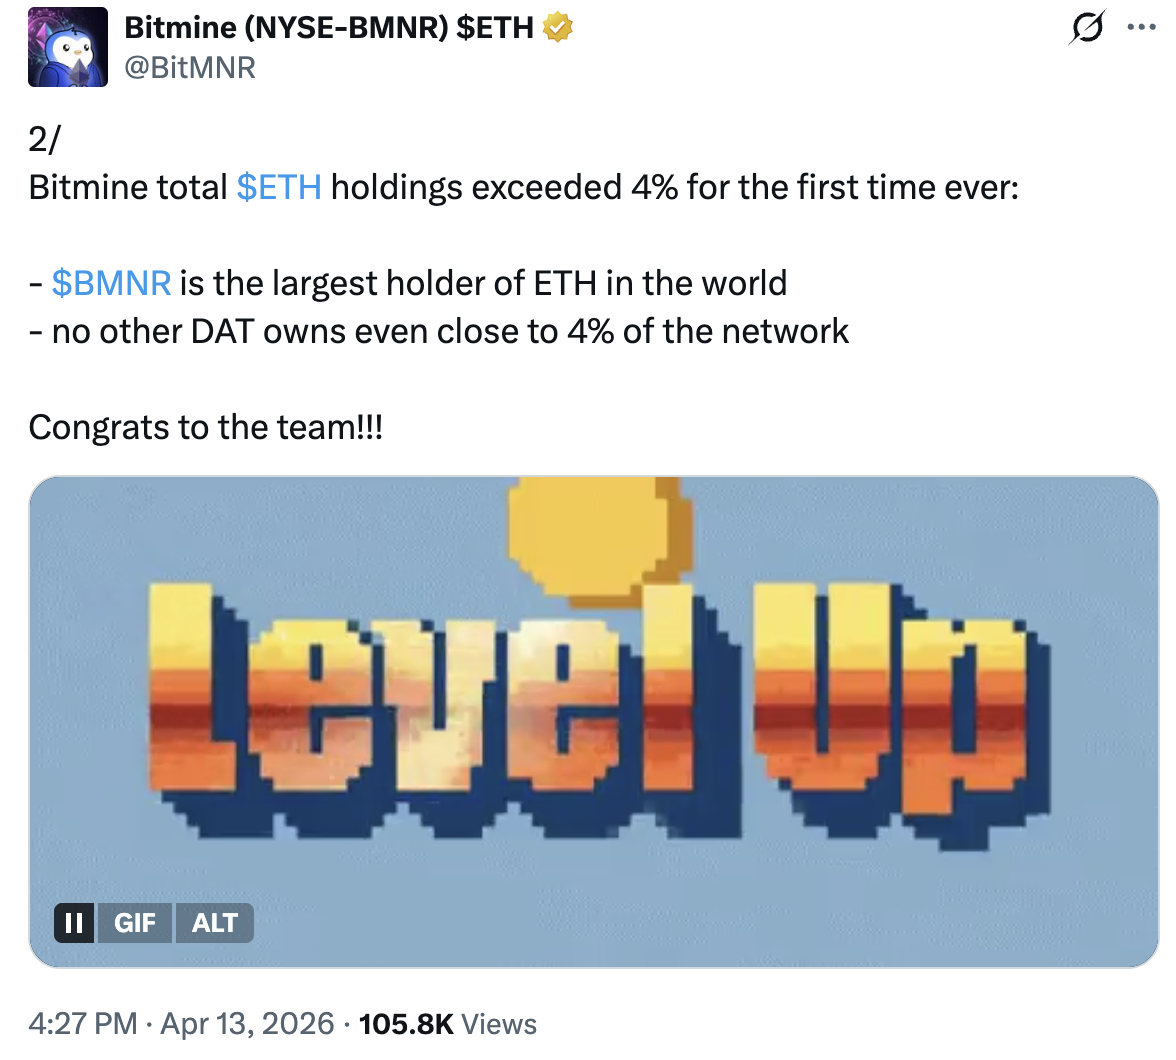
Source: X/Bitmine
These corporate treasury purchases act as a powerful vote of confidence, absorbing sell pressure and providing a solid bid under the market.
Together, ETF inflows and institutional buying have created a self-reinforcing rally. Institutional money is rotating into ETH precisely as derivatives positioning turns decisively bullish, setting the stage for continued upside.
How High Can the ETH Price Go?
Technically, Ethereum’s market structure is strengthening. The ETH/USD price action has formed an ascending triangle on the daily chart, with higher lows and a flat upper resistance near recent highs, as shown below.
A decisive breakout above this pattern’s upper trendline at $2,400 would target approximately $3,300—a measured move implied by the triangle’s height. Such a move would represent a 40% increase from the current price.
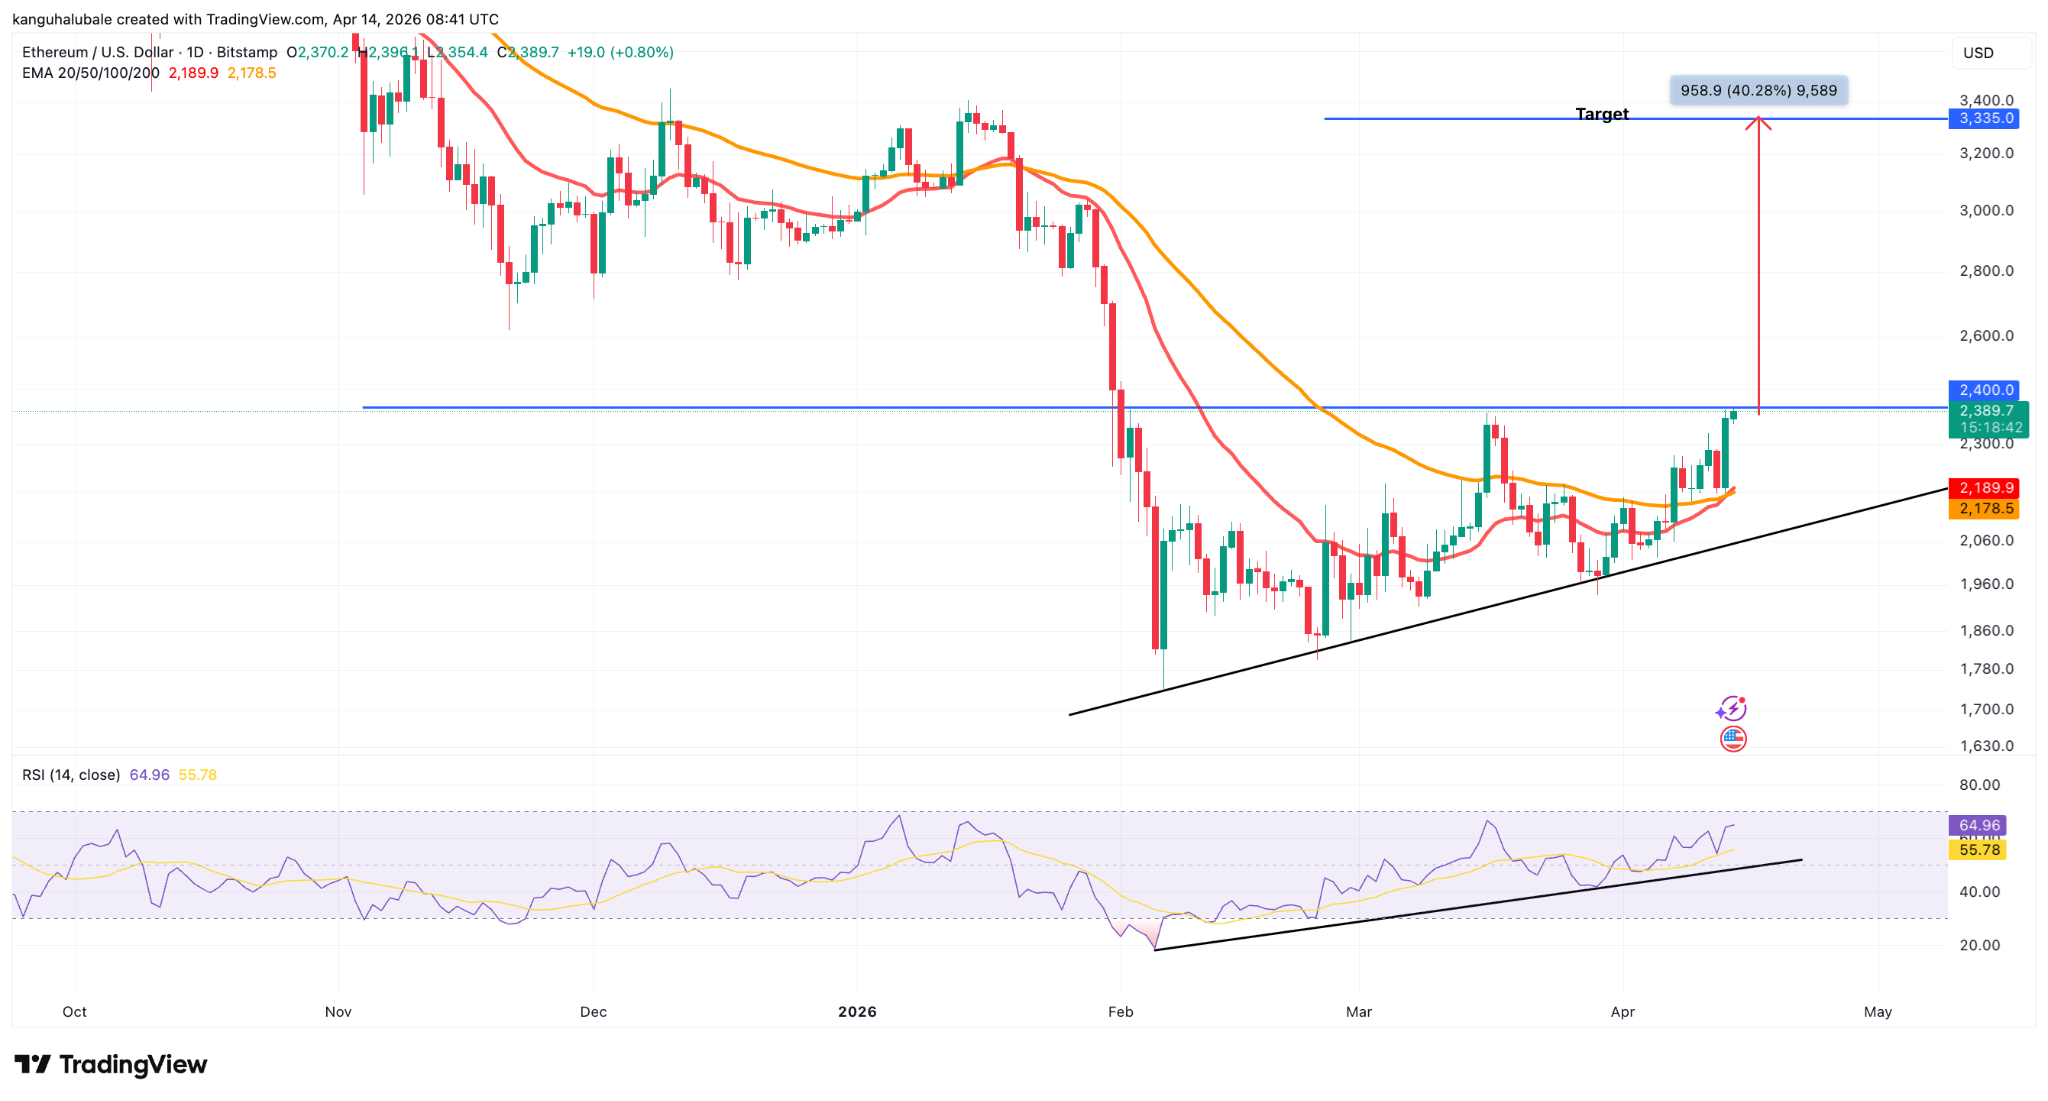
ETH/USD daily chart. Source: TradingView
Momentum indicators support the bullish case: RSI has climbed out of oversold territory to 65 at the time of writing, suggesting that the buyers are back in control.
If ETH maintains support above $2,200–$2,250, the triangle’s lower boundary, bulls remain firmly in control. A weekly close above $2,400 would further validate the breakout and open the door to $2,800–$3,000 in the medium term.
Ethereum’s 8% surge is more than a fleeting recovery. It reflects a convergence of improvements across price action, derivatives positioning, institutional flows, and onchain accumulation.
As the ascending triangle nears resolution, the market’s eyes are fixed on $3,300. Whether ETH reaches that target within April will depend on sustained momentum and the absence of external shocks, but current conditions suggest the bulls are well-positioned to test it.
We hope you enjoyed reading our analysis of Ethereum. If you’d like to trade with one of the best crypto CFD brokers, check out our list.