
Bearish view
Sell the BTC/USD pair and set a take-profit at 60,000.
Add a stop-loss at 75,000.
Timeline: 1-2 days.
Bullish view
Buy the BTC/USD pair and set a take-profit at 75,000.
Add a stop-loss 60,000.
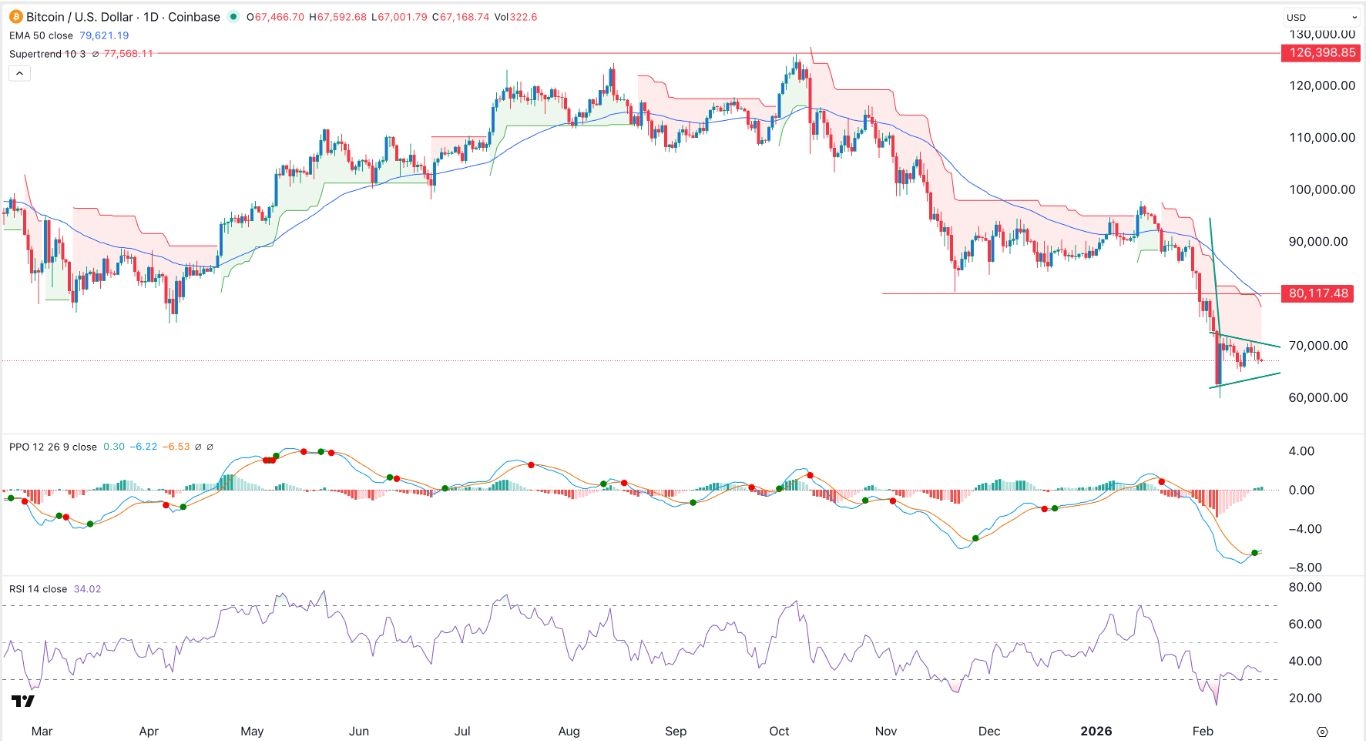
Bitcoin price pulled back to $70,000 on Thursday from this week's high of $72,550. The BTC/USD pair has dropped sharply from its all-time high of 126,200. It has formed a bearish flag pattern, pointing to more downside in the near term.
Bitcoin Price Slips Despite Morgan Stanley ETF Launch
The BTC/USD pair pulled back from its highest point this week as investors reacted to the US-Iran ceasefire that was announced on Tuesday.
There are signs the ceasefire may come under pressure as Israel continues its bombing of Lebanon, which Iran has condemned. Iran has warned that it may be forced to shut the Strait of Hormuz again.
Bitcoin price also wavered as market participants reacted to the launch of the Morgan Stanley spot Bitcoin ETF. The fund brought in over $34 million in inflows on the first day, a growth that may continue in the near term as it has the lowest fees.
Still, the fund may struggle because of the ongoing saturation in the industry as other large companies like BlackRock, Fidelity, Franklin Templeton, and Invesco have their own funds.
The BTC/USD pair will next react to the upcoming US macro data, including the fourth quarter GDP, US personal consumption expenditure (PCE), and consumer inflation. These numbers will provide more color on what to expect later this year.
For example, economists expect the upcoming numbers to show that the US economy slowed in the fourth quarter, while consumer inflation jumped to 3.3% in March as gasoline prices soared.
BTC/USD Technical Analysis
The three-day chart shows that the BTC/USD pair has dropped sharply this year. It dropped from a high of 126,200 in October last year to 71,000 today. It has slumped to the 50% Fibonacci Retracement level.
The pair has also dropped below the important support level at 74,304, its lowest level in April last year. It has dropped below the Supertrend indicator.
The pair has formed a bearish flag pattern, which is made up of a vertical line and an ascending channel. This pattern is one of the most common bearish signs in technical analysis.
Therefore, the most likely scenario is where the pair will resume the downward, potentially to the key support level at 60,000. A move above the resistance level at 74,300 will invalidate the bearish outlook.