
Bullish view
- Buy the BTC/USD pair and set a take-profit 74,500.
- Add a stop-loss at 65,000.
- Timeline: 1-2 days.
Bearish view
- Sell the BTC/USD pair and set a take-profit at 65,000.
- Add a stop-loss at 74,500.
Bitcoin price jumped above the key resistance level at $70,000 after President Donald Trump decided not to attack Iran’s key infrastructure as he had promised. The BTC/USD pair rose to 71,000, its highest point since March 26.
Bitcoin Price Jumps as Donald Trump TACOs
The BTC/USD pair rose as geopolitical tensions cooled down overnight after President Trump decided against striking Iran’s infrastructure, a few hours after he said that a whole civilization would die.
In a Truth Social post, Trump said that the US would suspend its planned strikes for two weeks as negotiations continue. His statement said that Iran would also need to reopen the Strait of Hormuz, which would lower crude oil prices and enable transit of crucial items like fertilizer and helium.
Bitcoin price also rose ahead of the upcoming launch of the spot Morgan Stanley Bitcoin ETF. This is the first time that a top Wall Street bank has launched a crypto ETF. The company hopes that the fund will attract substantial inflows because of its lower fees of 0.14%.
Spot Bitcoin ETFS have added assets in the last two months, ending a prolonged period of outflows. Data shows that these funds added over $1.32 billion in March and have added over $300 million this month so far. The funds now hold over $90 billion in assets, with BlackRock's IBIT being the biggest name.
The next big catalyst for the BTC/USD pair will be the upcoming Federal Reserve minutes, which will come out during the American session. These minutes will provide more information on what to expect in the upcoming meetings.
Most economists believe that the Fed will decide to leave rates unchanged in the next few meetings as officials observe the impact of the war on inflation and the labor market.
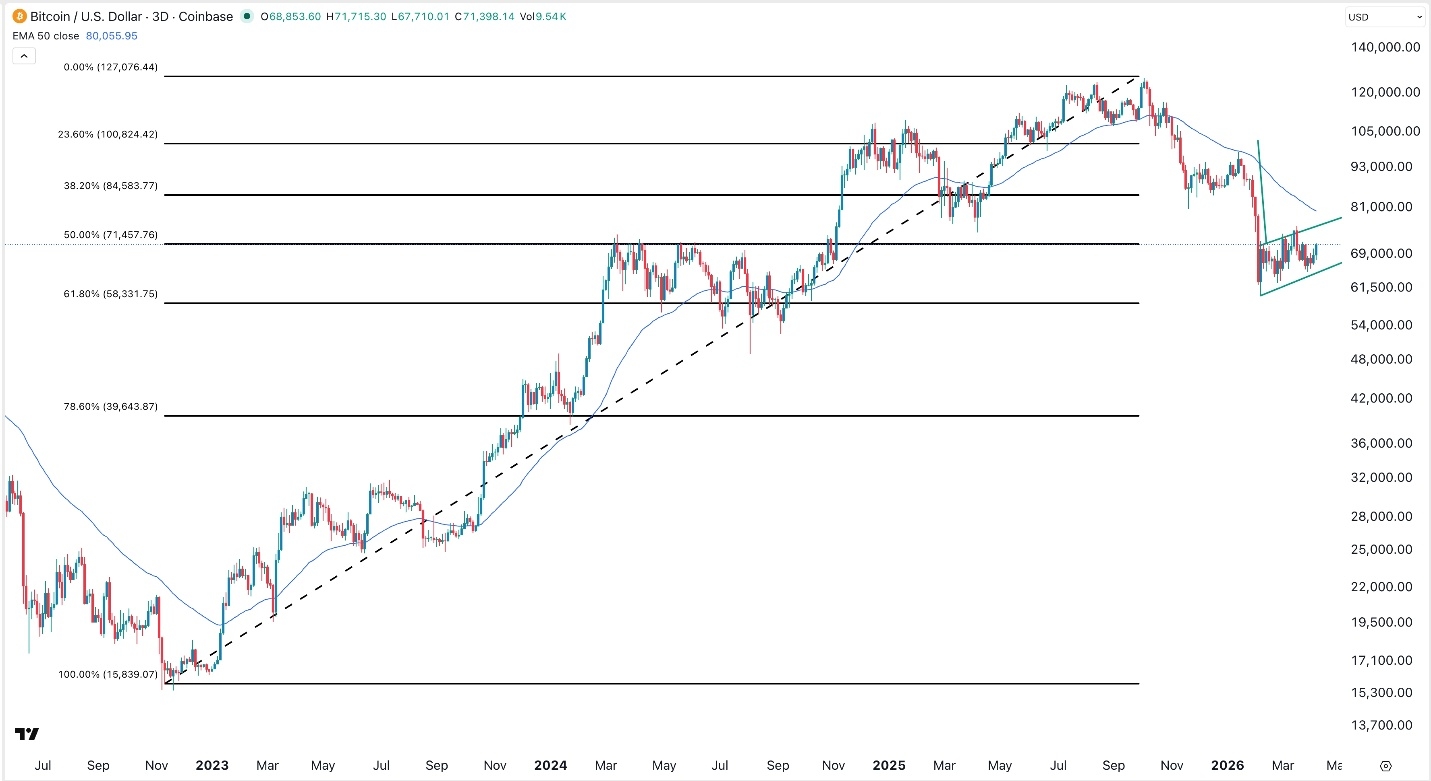
BTC/USD Technical Analysis
The three-day chart shows that the BTC price has formed an ascending channel in the past few weeks. This channel formed after the coin dropped sharply, meaning that it is part of the bearish flag pattern, a common continuation sign in technical analysis.
The BTC/USD pair has moved to the 50% Fibonacci Retracement level and has remained below the 50-day Exponential Moving Average. It has remained below the Ichimoku cloud indicator.
Therefore, the pair will likely resume the downward trend, and possibly retest the psychological level at 60,000. A move above the upper side of the rising channel will invalidate the bearish outlook.