
Bearish view
Sell the BTC/USD pair and set a take-profit at 60,000.
Add a stop-loss at 72,000.
Timeline: 1-3 days.
Bullish view
Buy the BTC/USD pair and set a take-profit at 72,000.
Add a stop-loss at 60,000.
Bitcoin price remained inside the narrow channel it has been in the past two months as demand from investors waned. The BTC/USD pair was trading at 68,000 on Monday, much lower than the all-time high of 126,200.
Bitcoin Pressured by Low Demand
Bitcoin price is under pressure amid the waning demand from global investors. SoSoValue data shows that spot Bitcoin ETFs have shed over $300 million this month, paring the gains they made last month when they added over $1.32 billion in assets.
More data shows that Bitcoin's future open interest has continued falling in the past few months, moving from over $95 billion in August last year to about $40 billion today. Falling open interest is a sign that investors are reducing their risk-taking in the crypto industry.
Meanwhile, American investors have taken a back seat in the crypto market, with the closely-watched Coinbase Premium Index remaining in the red in the past month. Historically, a positive index is usually a sign that demand in the most liquid market in the world is rising.
Bitcoin is also struggling as the Iran war pushes more people to embrace a risk-off sentiment. For example, the war has led to higher prices for key products like crude oil, natural gas, fertilizer, and airfares.
These numbers mean that US inflation will continue rising in the near term, making it hard for the Federal Reserve to cut interest rates in the near term. This explains why the stock market has also dropped in the past few weeks.
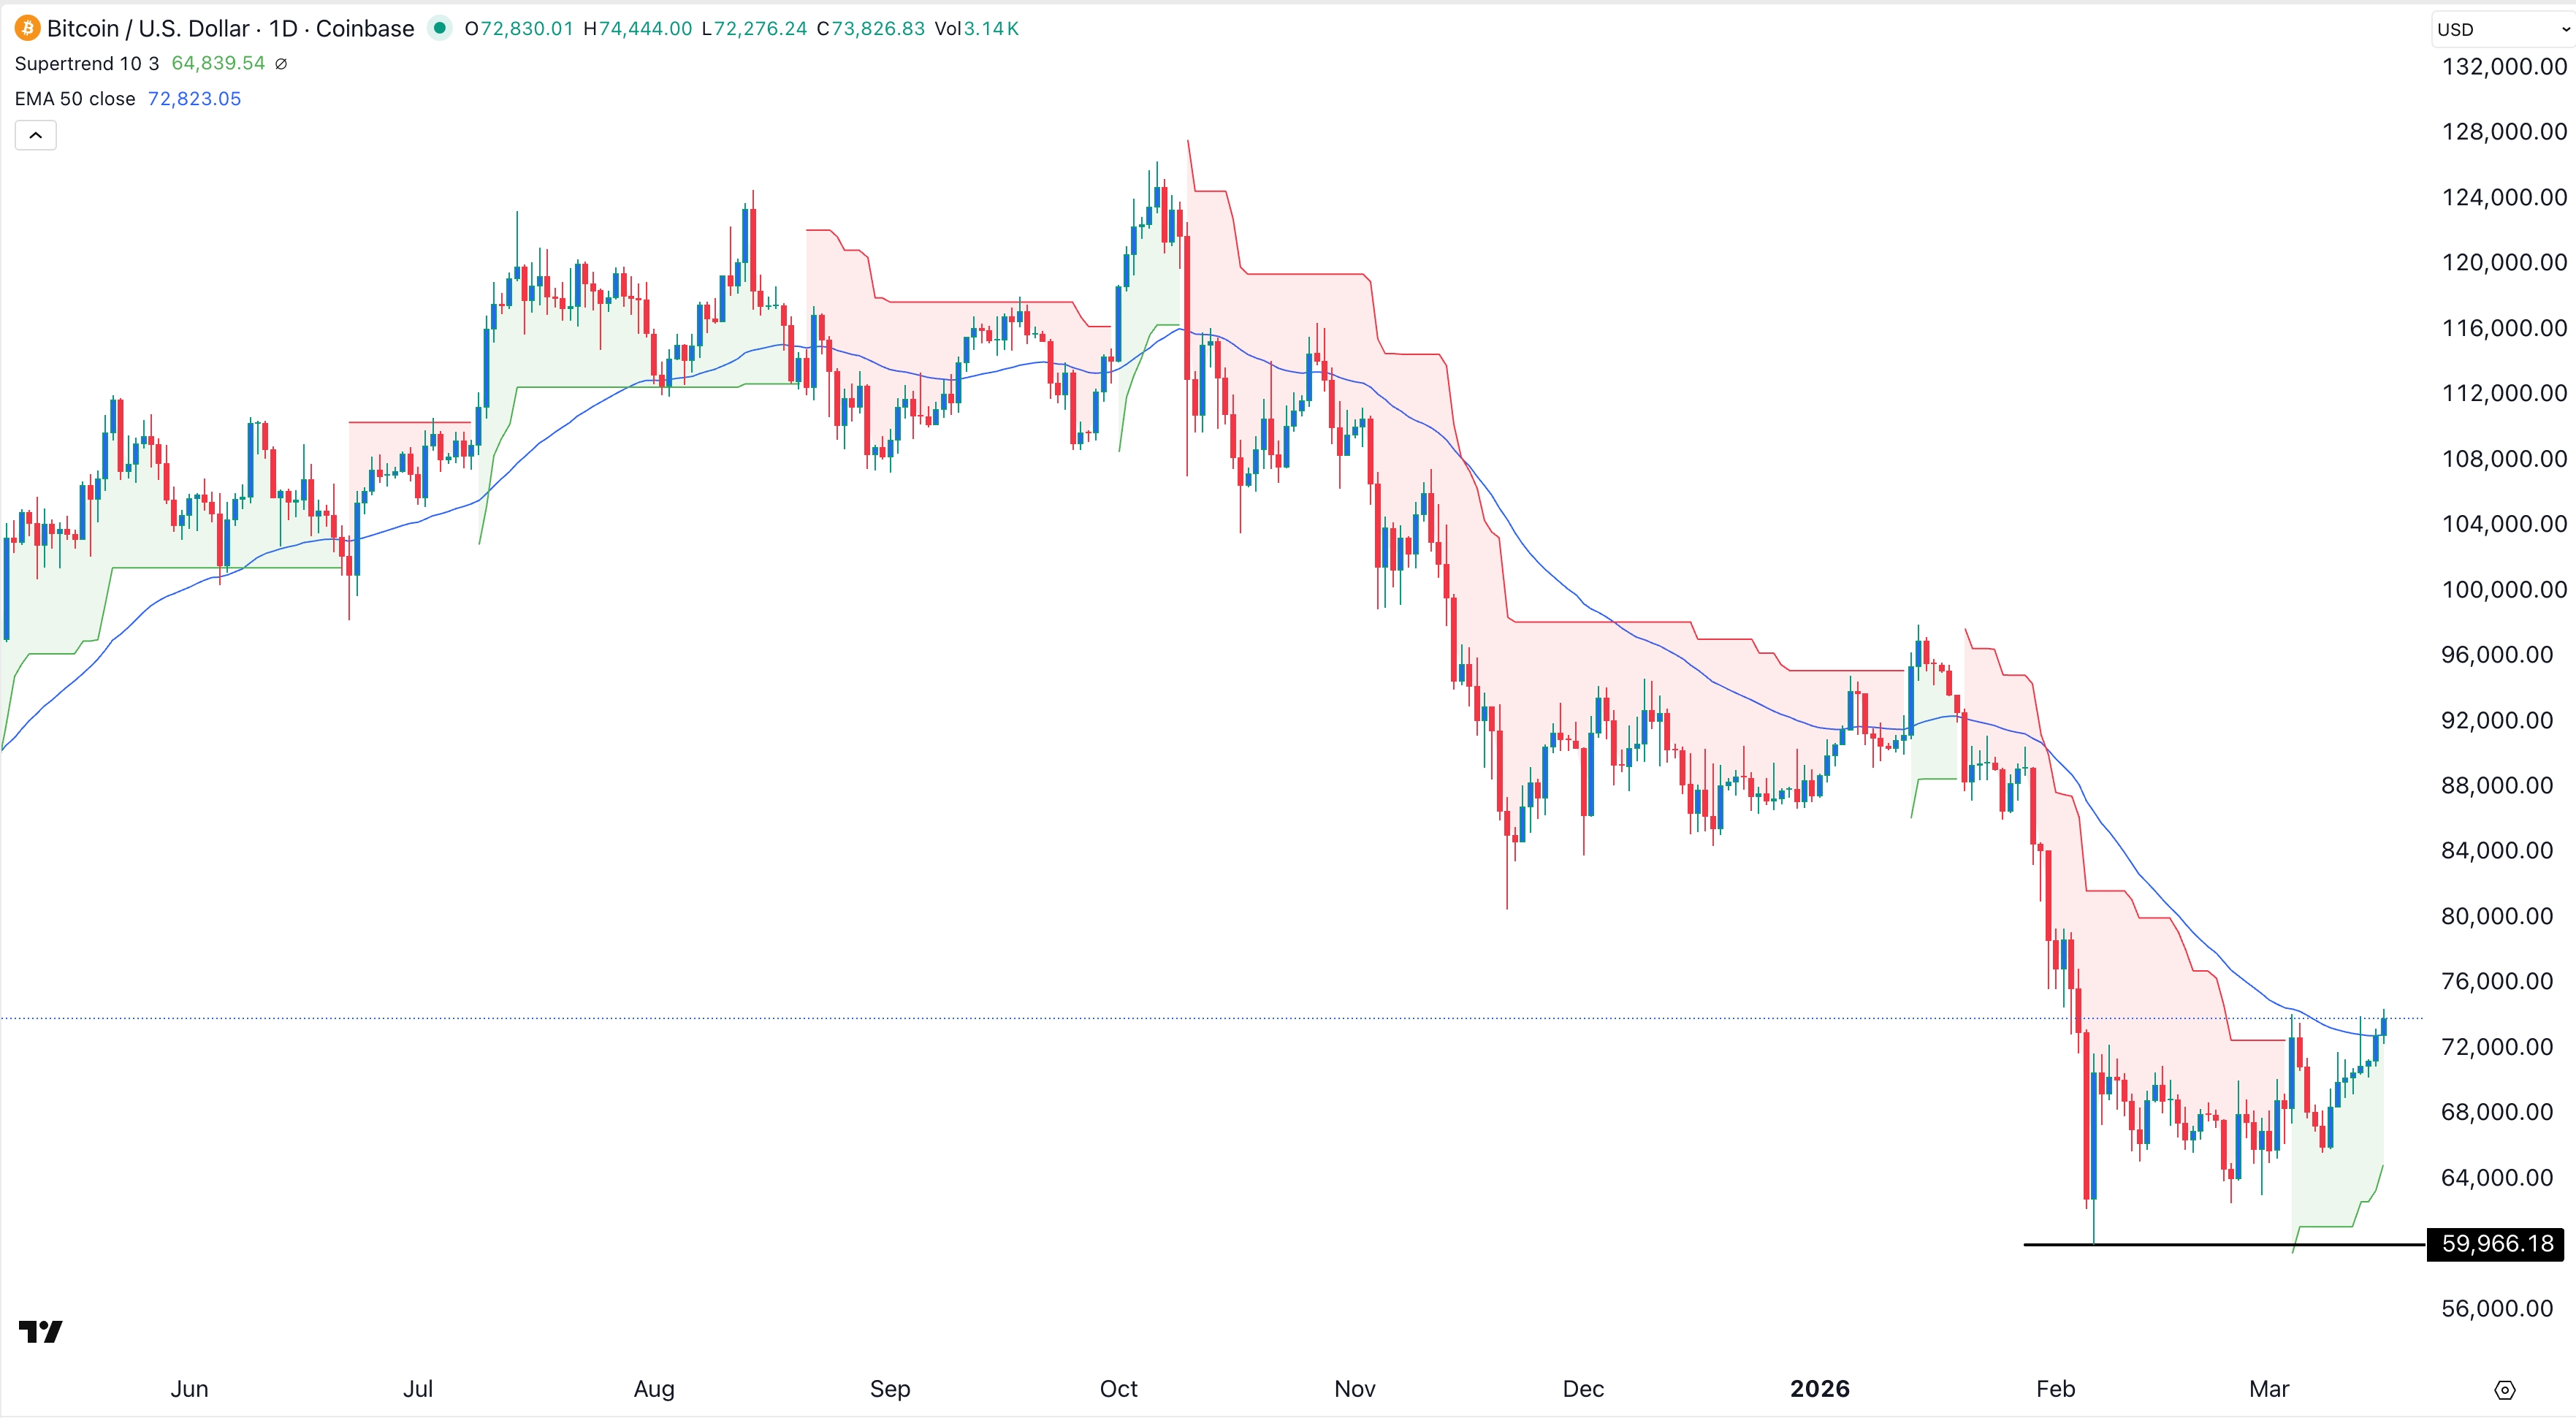
BTC/USD Technical Analysis
The daily timeframe chart shows that the BTC/USD pair has dropped sharply in the past few months as demand has waned. It has dropped below all moving averages, a sign that bears have prevailed.
Bitcoin price has also dropped below the Supertrend indicator. Most importantly, it has moved below the lower side of the ascending channel, which forms part of the bearish flag pattern. A bearish flag often leads to more downside in an asset.
Therefore, the BTC/USD pair will likely continue falling this week, potentially reaching the year-to-date low of 60,000. A drop below that level will point to more downside, likely to the psychological level at 50,000.
The bearish Bitcoin outlook will be invalidated if the coin rises and flips the resistance level at $76,000 into a support.