
Bullish view
Buy the BTC/USD pair and set a take-profit at 81,000.
Add a stop-loss at 75,000.
Timeline: 1-2 days.
Bearish view
Sell the BTC/USD pair and set a take-profit at 75,000.
Add a stop-loss at 81,000.
Bitcoin price continued rising this week, crossing the important resistance level at $78,000 as the bull run gained steam. The BTC/USD pair rose to 79,000 for the first time since January. It has jumped by over 31% from its lowest level this year.
Bitcoin has thrived amid the ongoing ETF inflows, which are sending a signal that there is strong demand from investors.
Data shows that spot Bitcoin ETFs are nearing the $2 billion mark this month. These funds, led by BlackRock’s IBIT, have added over $58 billion in assets, bringing the total assets to $100 billion.
The ongoing ETF inflows mean that investors have started to rotate from gold to Bitcoin. Data shows that top gold ETFs like GLD and IAU have lost millions of dollars in the past few weeks.
Bitcoin is also doing well amid the relentless whale buying. Data shows that whales have bought coins worth millions of dollars in the past few months. Additionally, companies like Strategy and American Bitcoin have continued buying Bitcoin in the past few weeks.
Strategy now holds Bitcoins worth over $64 billion, with the average cost being $75,528. Its Bitcoin holdings have made a 4.3% profit. Similarly, American Bitcoin, a top company associated with Eric Trump, added more coins, bringing its total holdings to 7,000.
BTC/USD Technical Analysis
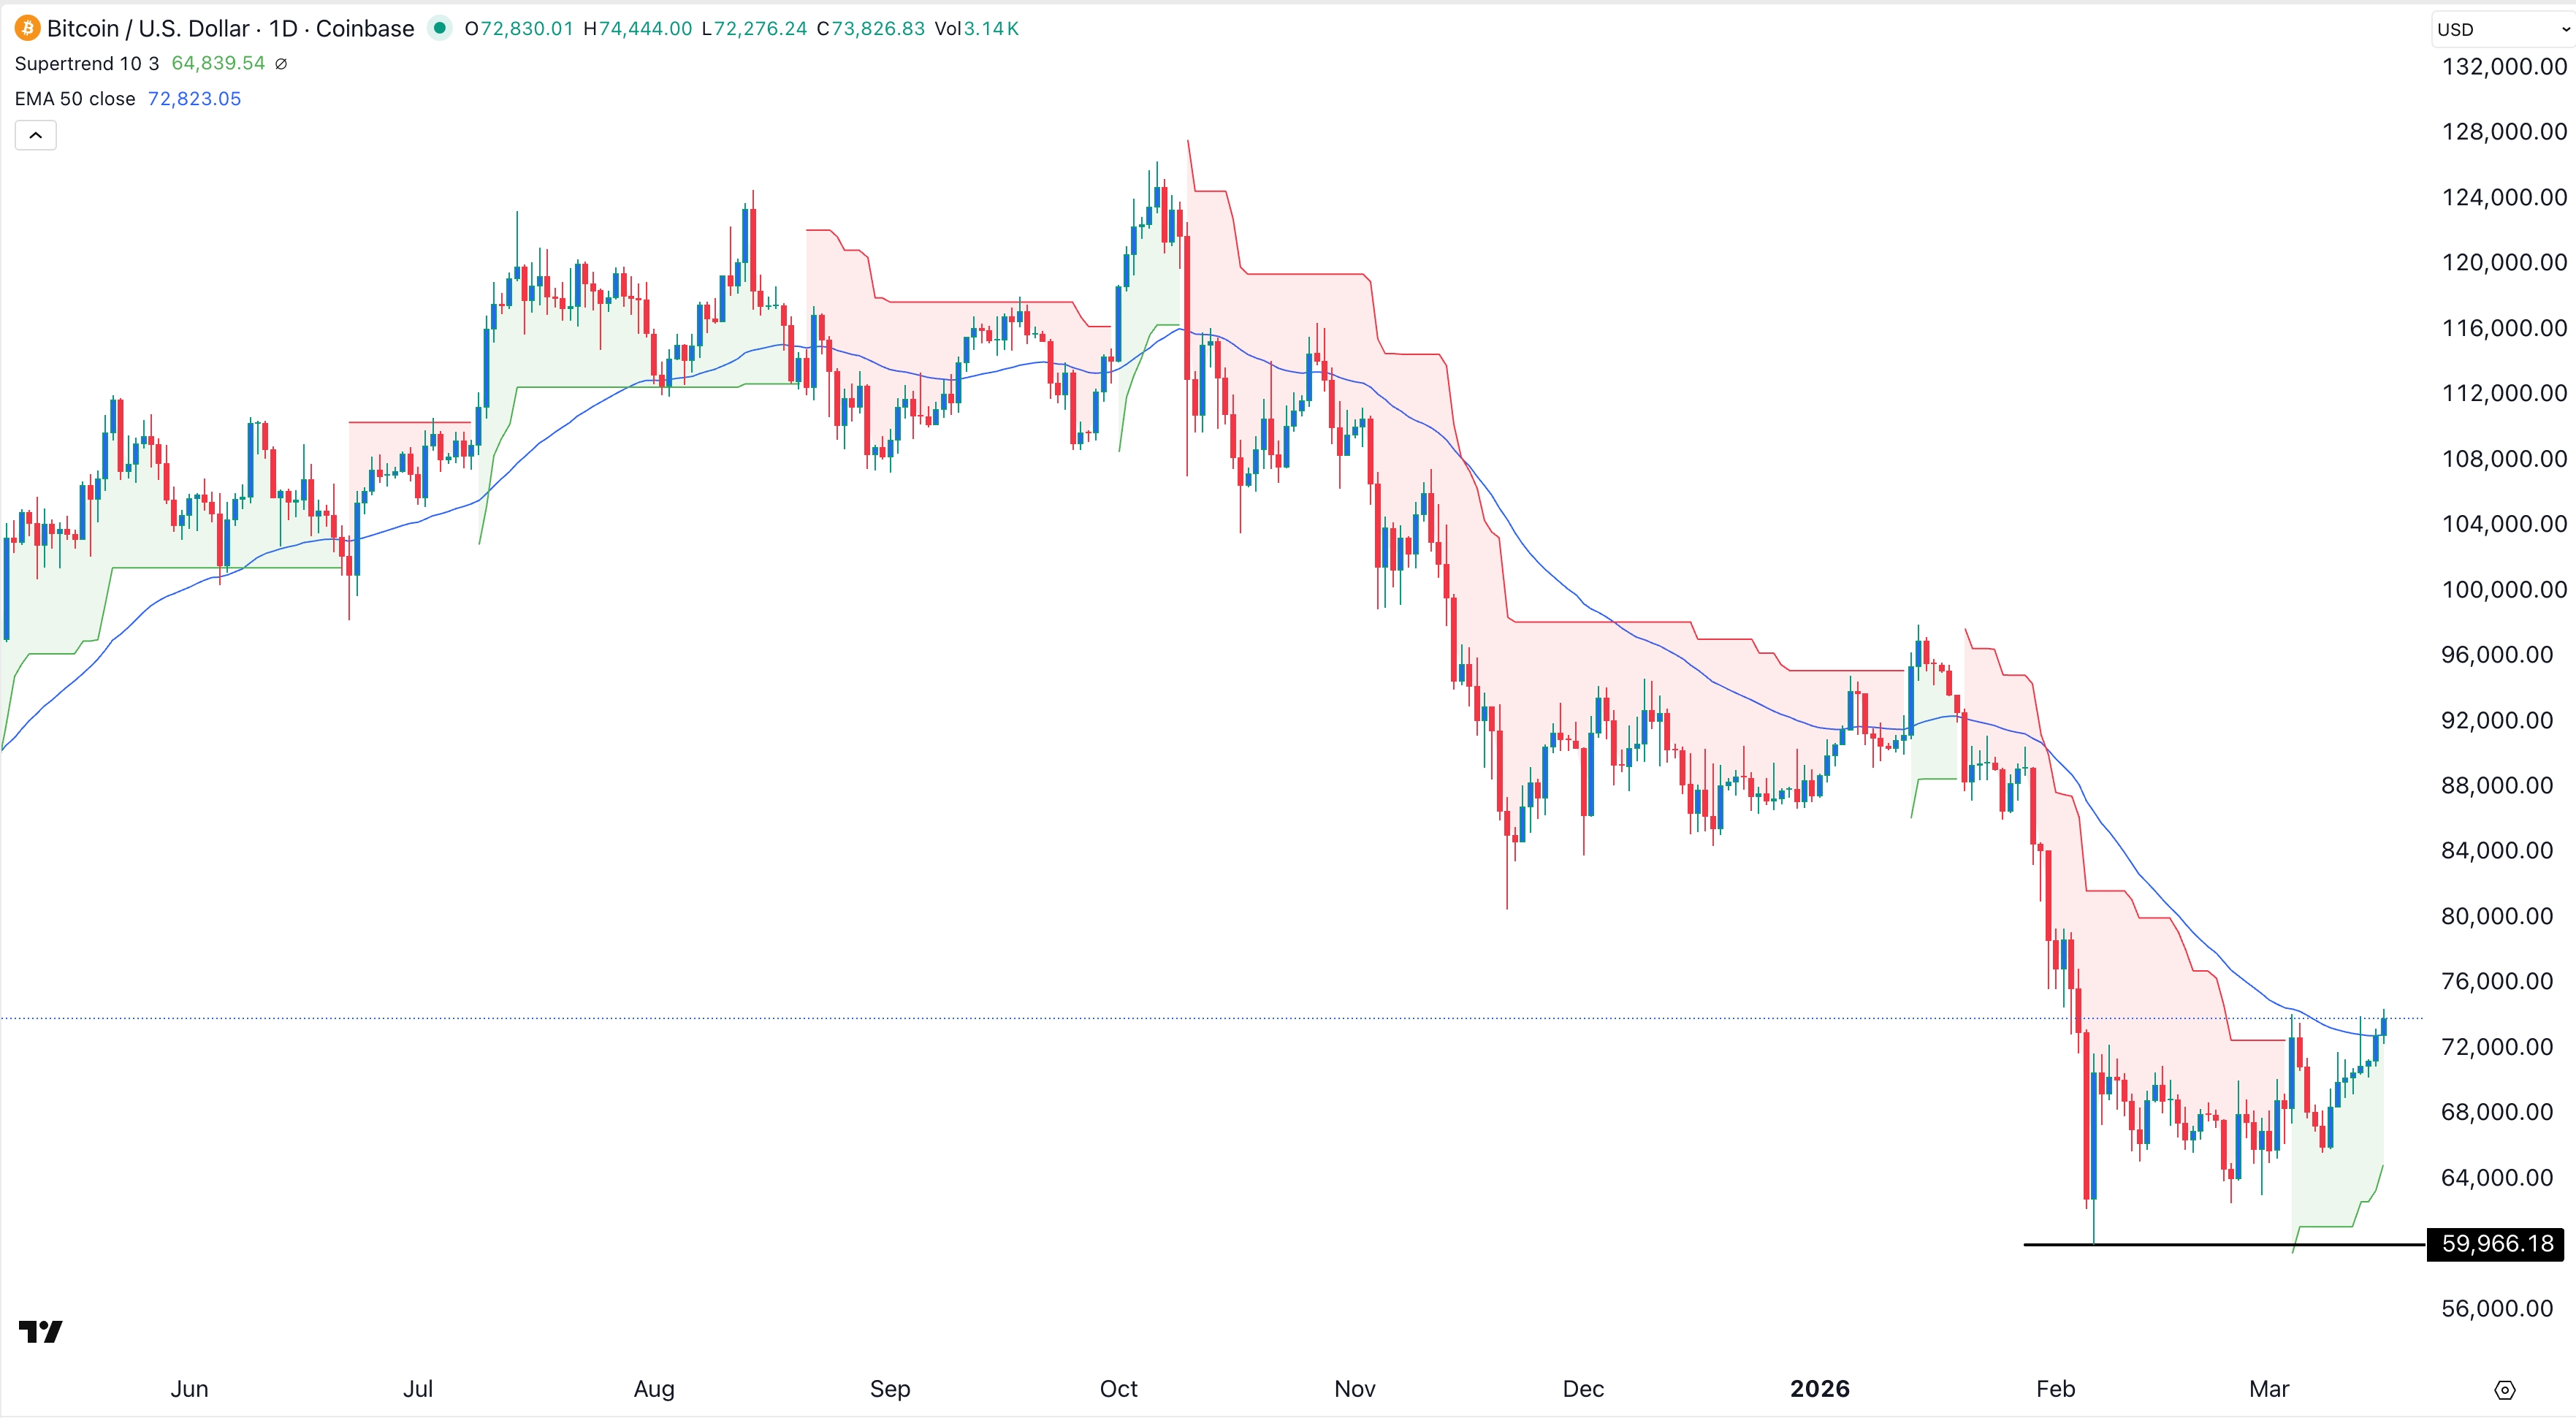
The daily timeframe chart shows that the BTC/USD pair has rebounded from a low of 60,000 in February to 79,000 today. It has now moved above the important resistance level at 76,410, its highest point in March.
Bitcoin price has soared above the 50-day and 100-day Exponential Moving Averages (EMA), while the Supertrend indicator has turned from red to green.
At the same time, the Relative Strength Index (RSI) and the MACD indicators have continued rising, a sign that it is gaining momentum.
Therefore, the most likely scenario is where the coin continues rising, potentially to the key resistance level at 81,000. On the flip side, a drop below the key support at 76,400 will invalidate the bullish outlook and lead to more downside.