
Bullish view
Buy the BTC/USD pair and set a take-profit at 81,000.
Add a stop-loss at 70,000.
Timeline: 1-2 days.
Bearish view
Sell the BTC/USD pair and set a take-profit at 70,000.
Add a stop-loss at 81,000.
Bitcoin price has remained in a narrow range this week despite the soaring exchange-traded funds (ETFs) inflows. The BTC/USD pair was trading at 75,300 on Wednesday, up by 26% from its lowest level this year. It has formed an ascending triangle pattern, pointing to more gains in the near term.
Top Regulated Brokers
Bitcoin Price Steady Amid ETF Inflows
The BTC/USD pair has held steady in the past few days as investors continued buying spot Bitcoin ETFs.
Data shows that these funds have added assets in the last six consecutive days, bringing the total inflows this month to nearly $2 billion, higher than last month’s $1.32 billion.
These funds have now added over $58 billion since its inception, bringing the cumulative assets to over $100 billion. Spot Bitcoin ETFs have added over $65 billion and now have $61.52 billion.
Bitcoin has also benefited from the ongoing Strategy buyout this month. The company bought coins worth over $2.54 billion last week, with the total holdings hitting 815,062. Its holdings are now worth over $61 billion, with its net asset value (NAV) rising to 0.89.
Bitcoin price also remained in a narrow range after Kevin Warsh's testimony in the Senate Banking Committee. Warsh, who has experienced support for Bitcoin and the industry, was not asked about it.
Instead, he noted that he will maintain the Federal Reserve’s independence, which has come under pressure under President Donald Trump.
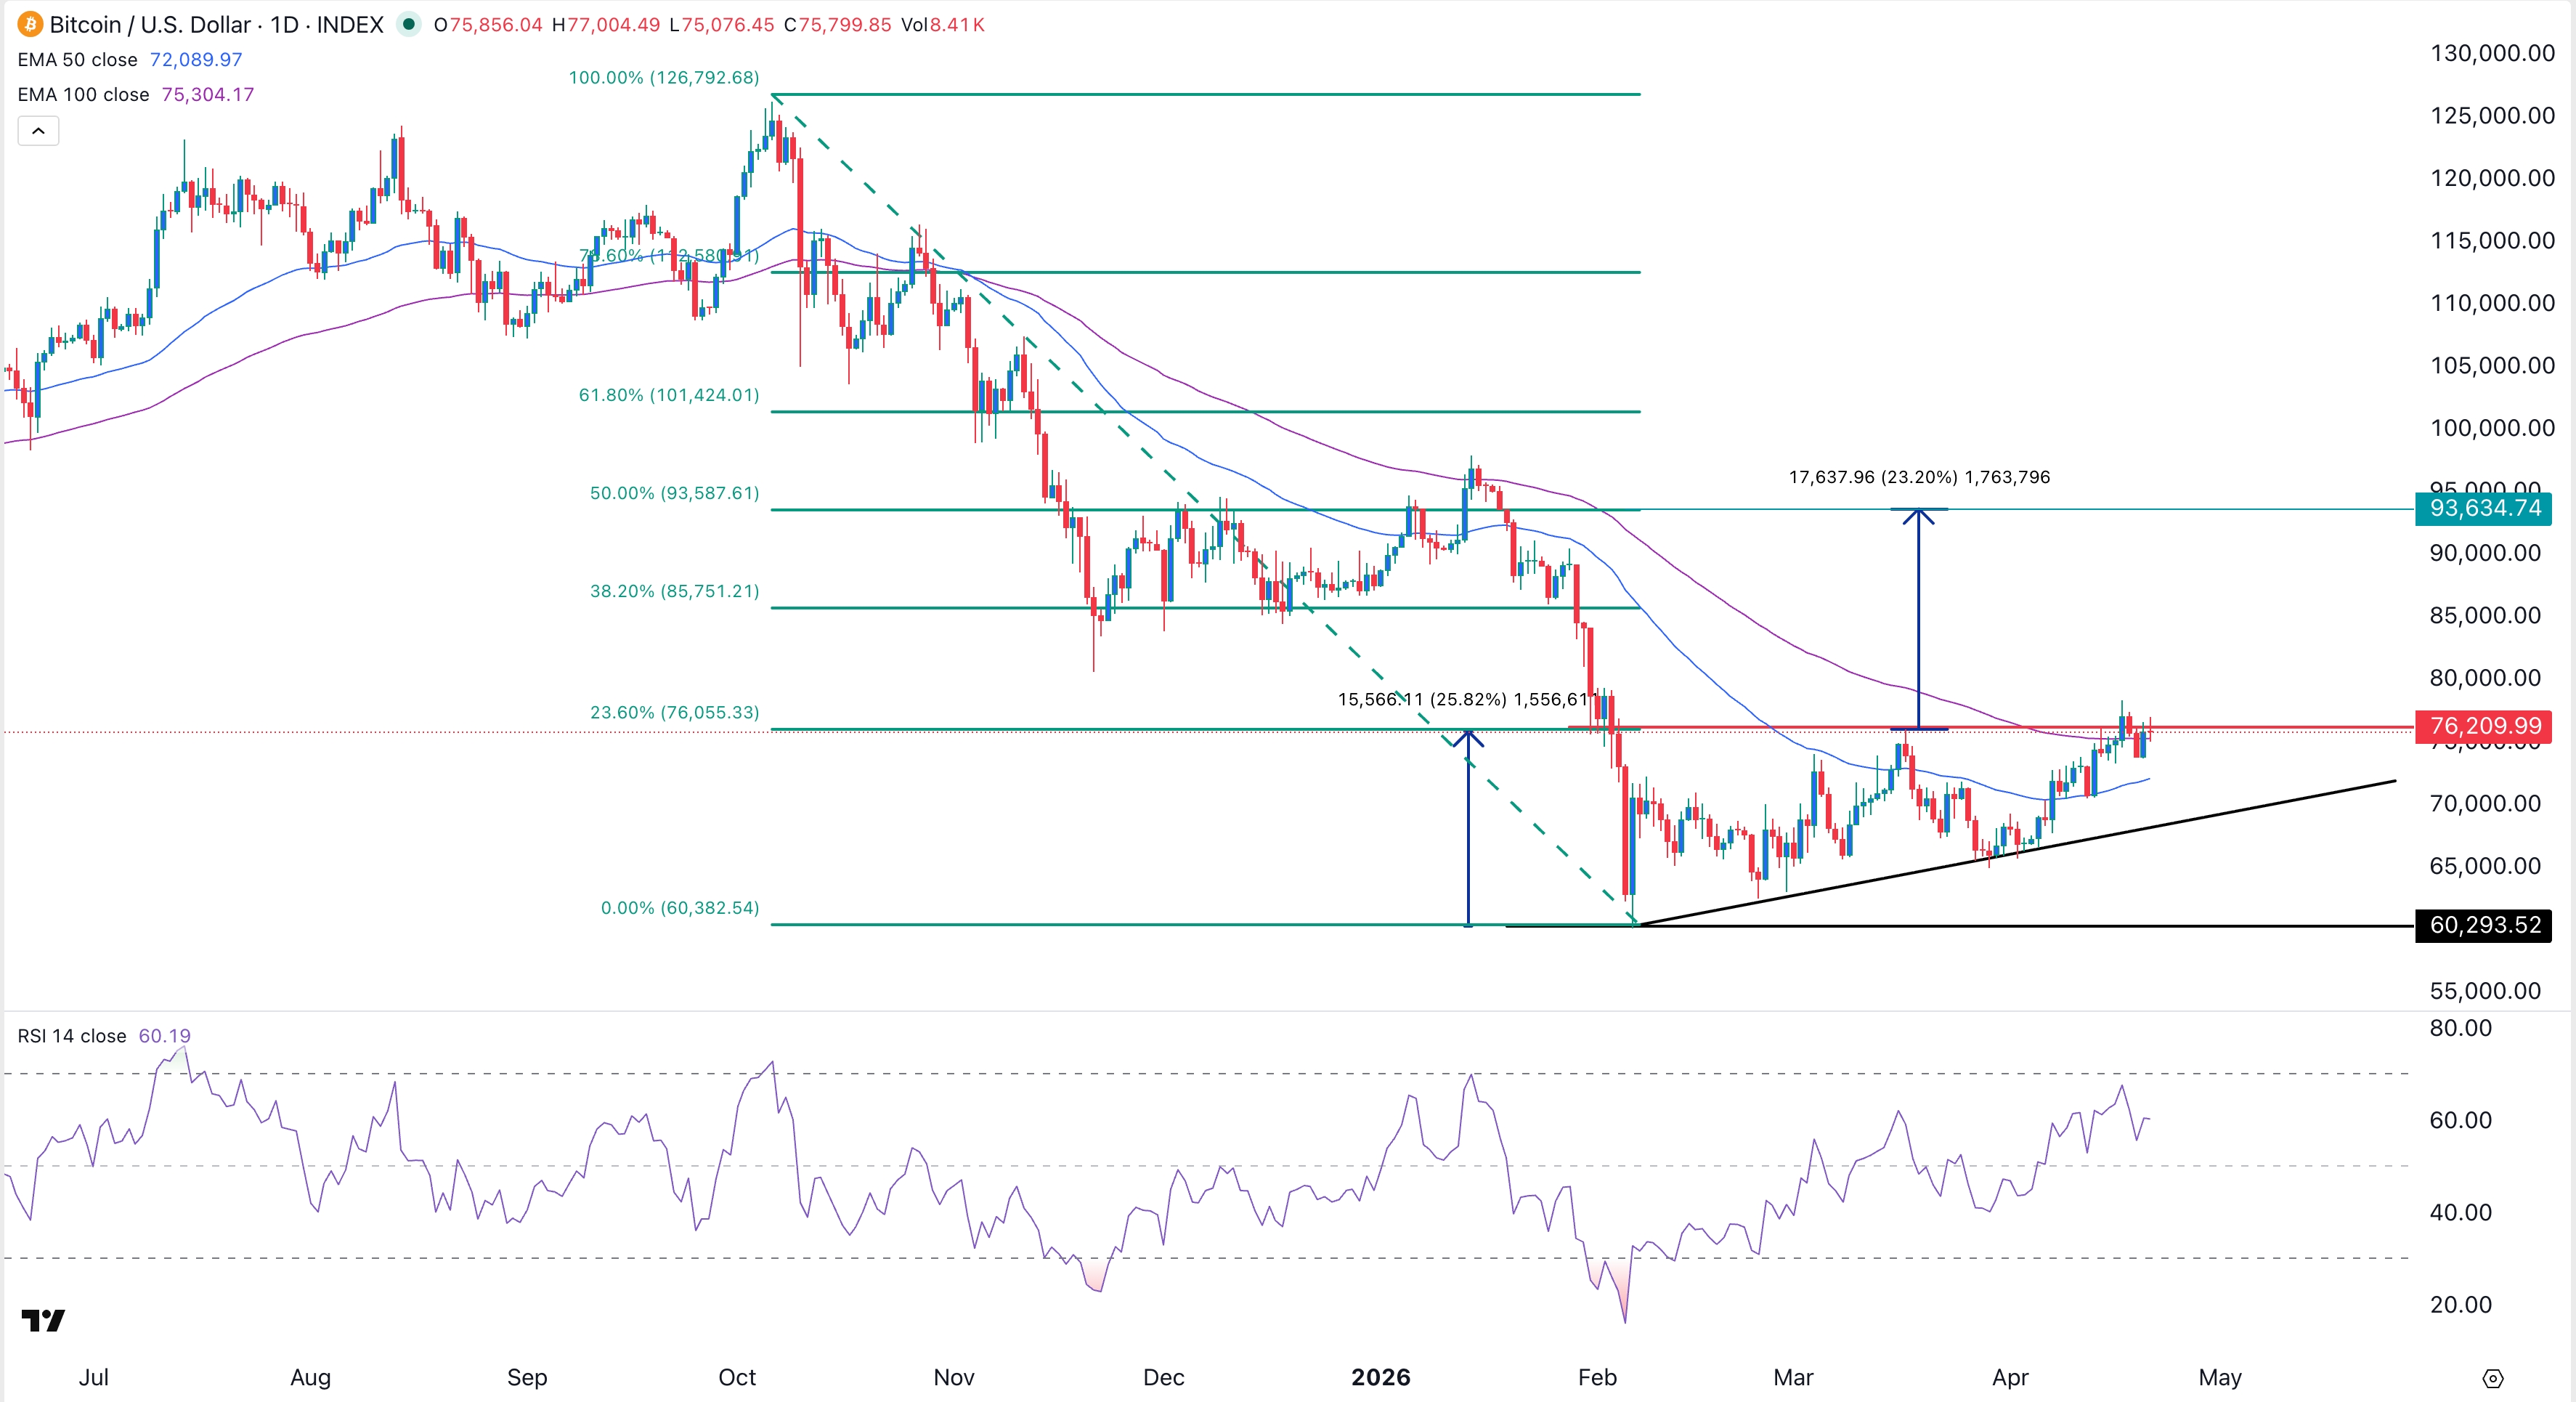
BTC/USD Technical Analysis
The daily chart shows that the BTC/USD pair has held steady in the past few months. It has jumped by over 20% from its lowest level this year.
Bitcoin has moved above the 50-day and 100-day Exponential Moving Averages (EMA). It has moved above the Supertrend indicator, a sign that bulls are in control.
The coin is now hovering at the 23.6% Fibonacci retracement level. At the same time, the Relative Strength Index (RSI) and the MACD indicators continued rising.
Therefore, the BTC/USD pair will likely continue rising as bulls target the 38.2% Fibonacci retracement level at 85,750. More gains above that level will point to more gains, potentially to the 50%Fibonacci retracement level 93,587.
On the flip side, a drop below the lower side of the ascending trendline will point to more downside, potentially to the year-to-date low of 60,000.
Ready to trade Bitcoin in USD? We’ve shortlisted the best MT4 crypto brokers in the industry for you.