
Bearish view
Sell the BTC/USD pair and set a take-profit 70,000.
Add a stop-loss at 78,000.
Timeline: 1-2 days.
Bullish view
Buy the BTC/USD pair and set a take-profit at 78,000.
Add a stop-loss at 70,000.
The BTC/USD pair held steady above the key resistance level at 74,000 as the recent recovery lost momentum. Bitcoin has jumped by 25% from its lowest level this year and is hovering near its highest point since March 17.
Bitcoin Rally Stalls as ETF Inflows Rise
The BTC/USD pair has made some modest recovery in the past few months, moving from a low 60,000 in February to 74,400.
Data shows that spot Bitcoin ETFs have continued adding assets this week. These funds added over $411 million in assets on Tuesday, bringing the monthly increase to over $741 million. The total inflows rose to $56 billion, bringing the net assets to over $96 billion.
Bitcoin has done well as investors have embraced a risk-on sentiment amid the ongoing hopes that the war in Iran will end soon.
President Donald Trump and Iranian leaders have expressed hopes that the war will end soon. However, Iran has warned of a potential closure of the Red Sea route if the US blockade continues.
Bitcoin's price action has mirrored that of the broader stock market, where the top indices like Dow Jones and the Nasdaq 100 have done well in the past few weeks. The S&P 500 Index rose by 40 points, while the Nasdaq 100 rose by over 272 points.
The next key catalyst for the BTC/USD pair will be the key macro data, which will impact the Federal Reserve. Some of the key data to watch will be the US initial jobless claims, Philadelphia Fed manufacturing index, and industrial production. Economists expect the Fed to maintain interest rates steady in the coming meetings as it observes the impact of the ongoing war on inflation.
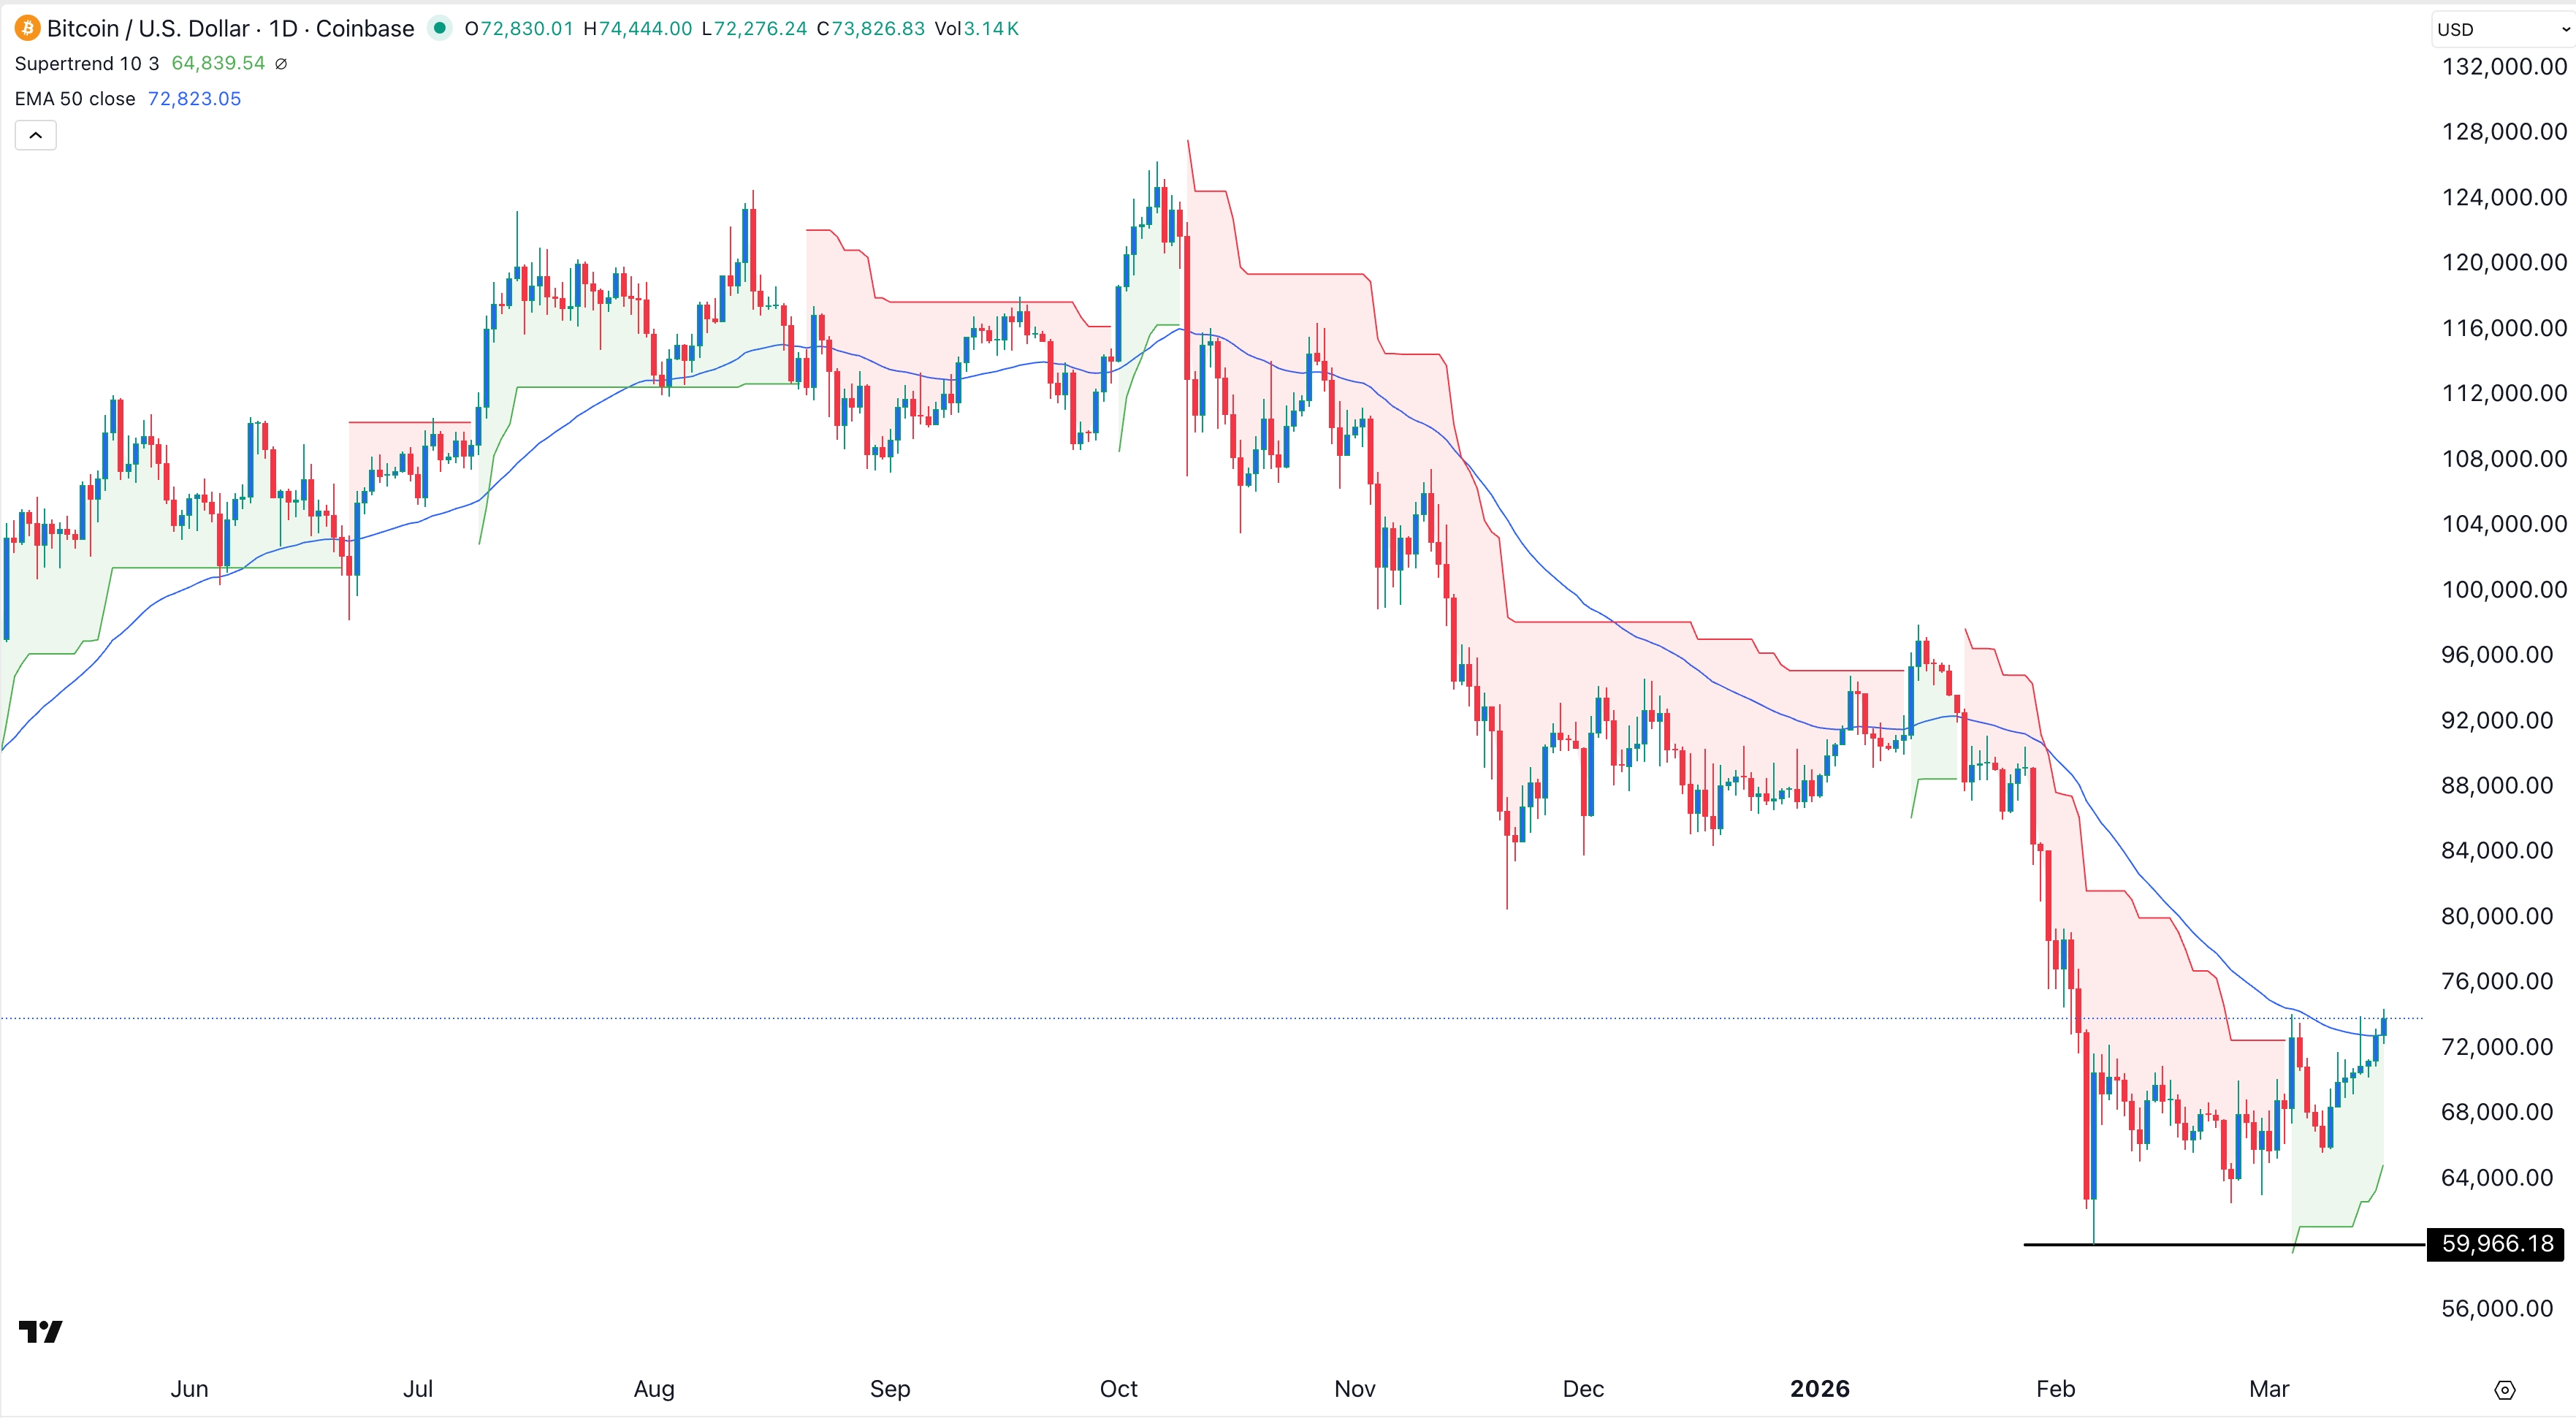
BTC/USD Technical Analysis
The daily timeframe chart shows that the BTC/USD pair rose to a high of 75,770, its highest level since March 17.
This rebound, however, is showing signs of exhaustion as the pair has formed a small double-top pattern. It also formed a small doji candlestick pattern, which is a common bearish reversal sign in technical analysis.
The pair has also remained below the 100-day Exponential Moving Average (EMA), a sign that bears remain in control for now.
Therefore, the most likely Bitcoin forecast is bearish, with the next key target being at the psychological level at 70,000. However, a break above the key resistance level at $75,770 will invalidate the bullish outlook and point to more downside.