
Bearish view
Sell the BTC/USD pair and set a take-profit at 60,000.
Add a stop-loss at 77,000.
Timeline: 1-2 days.
Bullish view
Buy the BTC/USD pair and set a take-profit at 77,000.
Add a stop-loss at 65,000.
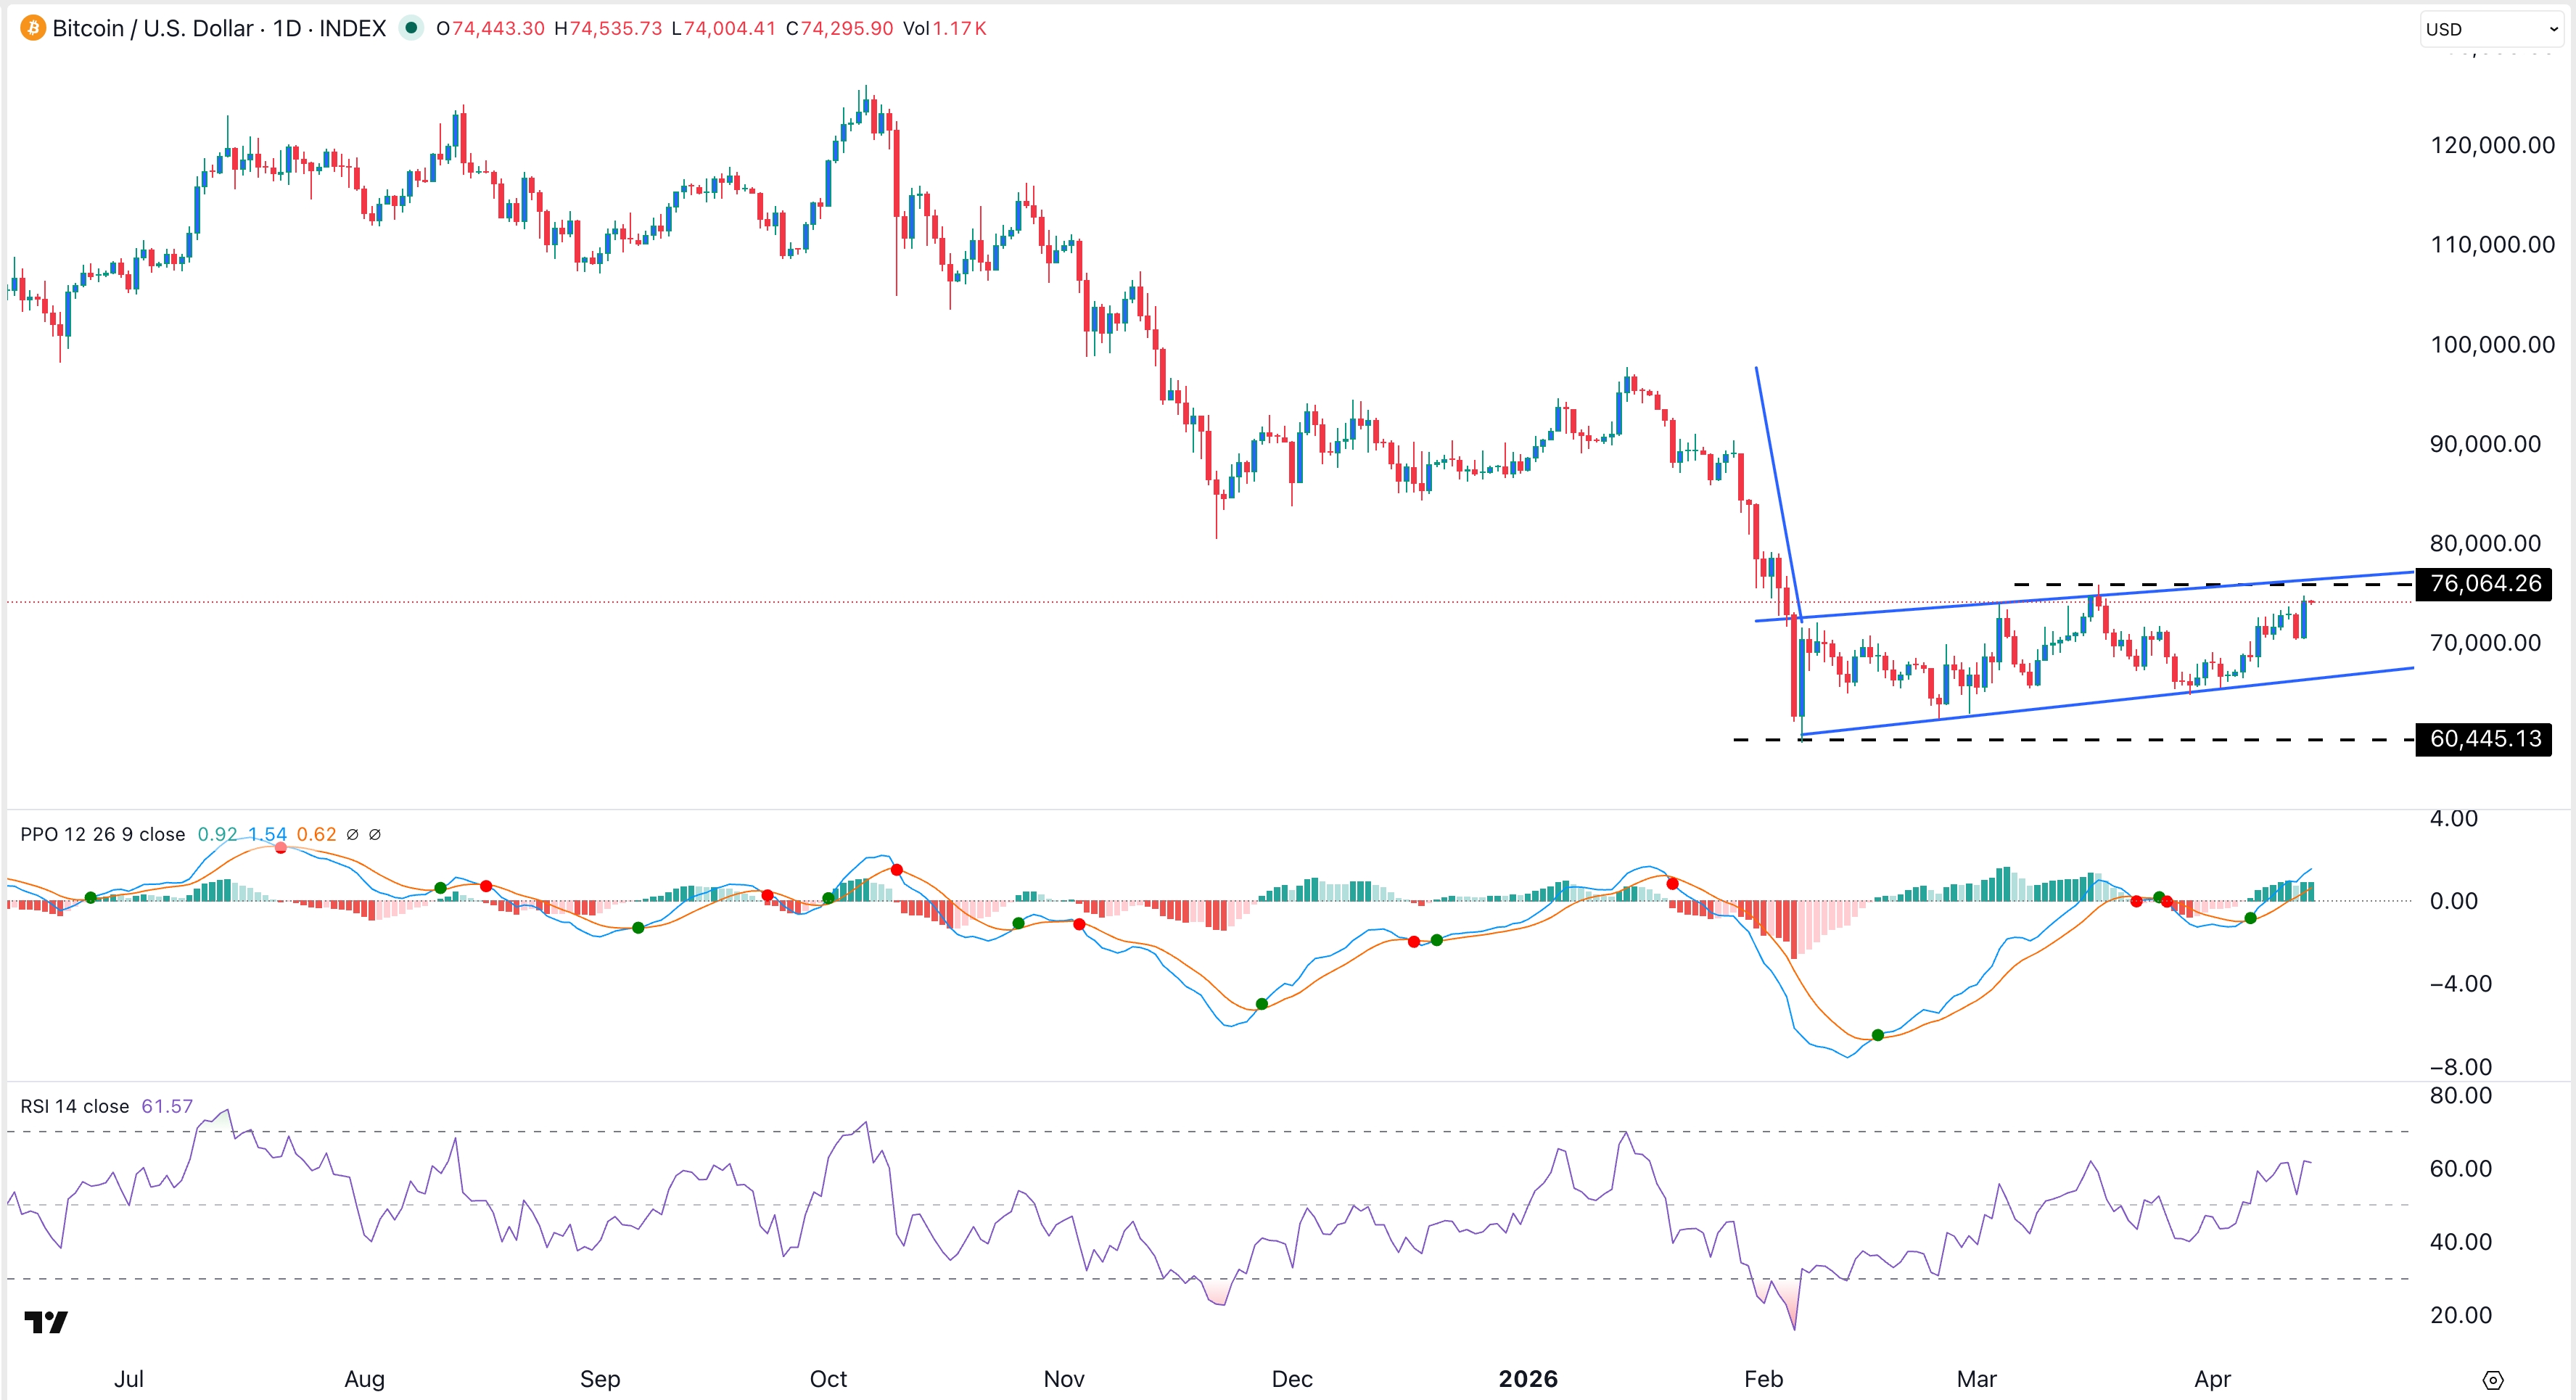
Bitcoin price remained steady above the important support level of $70,000 as traders brushed off the risks posed by the closure of the Strait of Hormuz. The BTC/USD pair was trading at 74,275, up substantially from the year-to-date low of 60,000.
Bitcoin Price Jumps as Strait of Hormuz Closure Starts
The BTC/USD pair rose on Tuesday even as the closure of the Strait of Hormuz happened. In a statement, Donald Trump said that the Strait will be blockaded, a move meant to bring Iran's revenue to zero.
Iran responded by warning its gulf partners that their ports will also see weak activity as the blockade continues. Therefore, analysts believe that this blockade may have a major impact on key commodities like crude oil, fertilizer, and helium.
The ongoing price action is a sign that investors anticipate more talks between the US and Iran before the two-week ceasefire ends. This explains why the US dollar has dropped against most assets and the US stock market also jumped.
The BTC/USD pair rose as investors continued buying spot Bitcoin ETFs. Data shows that these funds have added over $500 million in assets this month. It is the second consecutive month of purchases, a sign that the accumulation process is continuing.
BTC/USD Technical Analysis
The daily chart shows that the BTC/USD pair has moved sideways in the past few months. It remains below the important resistance level at 76,055, its highest point in March this year.
A closer look shows that it has formed an ascending channel, which happens after a sharp decline in January this year. This could be the formation of a bearish flag pattern, which often leads to a strong bearish breakdown.
Therefore, the coin will likely have a bearish breakdown in the near term. If this happens, the next key level to watch will be at 65,000 followed by the psychological level at 60,000