
Bullish view
Buy the BTC/USD pair and set a take-profit at 80,000.
Add a stop-loss at 68,000.
Timeline: 1-2 days.
Bearish view
Sell the BTC/USD pair and set a take-profit at 68,000.
Add a stop-loss at 80,000.
Bitcoin price remained in an uptrend on Monday as American investors continued accumulating the coin. The BTC/USD pair rose to 74,000 on Monday, its highest point in over three weeks. It has moved into a bull market after rising by over 20% from its lowest level this year.
Spot Bitcoin ETF Inflows Have Soared
The BTC/USD pair has jumped in the past few weeks, helped by the ongoing accumulation by American investors.
Data shows that spot Bitcoin ETFs added over $786 million last week, a bigger number than the previous week’s $22 million. They have now added over $621 million this month after adding $1.32 billion last month.
This buying is a sign that investors have intensified their accumulation, which is usually a highly bullish sign in technical analysis. BlackRock’s IBIT now holds $57 billion, while Fidelity’s FBTC has $13.8 billion in assets.
The same recovery is happening in the ongoing jump in the futures open interest, which has moved to nearly $50 billion, up from the year-to-date low of $39 billion. Soaring open interest is a sign that demand is rising.
Bitcoin price rose after the US released the latest US consumer inflation report on Friday, which provided more information on the impact of President Donald Trump’s Iran war that pushed crude oil and natural gas prices soared. The headline consumer inflation jumped to 3.3% in March from the previous 2.4%.
US consumer confidence has also plunged to the lowest level since 2009. It has continued falling in the past few weeks as gasoline prices jumped to above $4 a gallon. There is a risk that the US economy is now in a stagflation as inflation is elevated while a recent report showed that the economy barely expanded in the last quarter of the year.
BTC/USD Technical Analysis
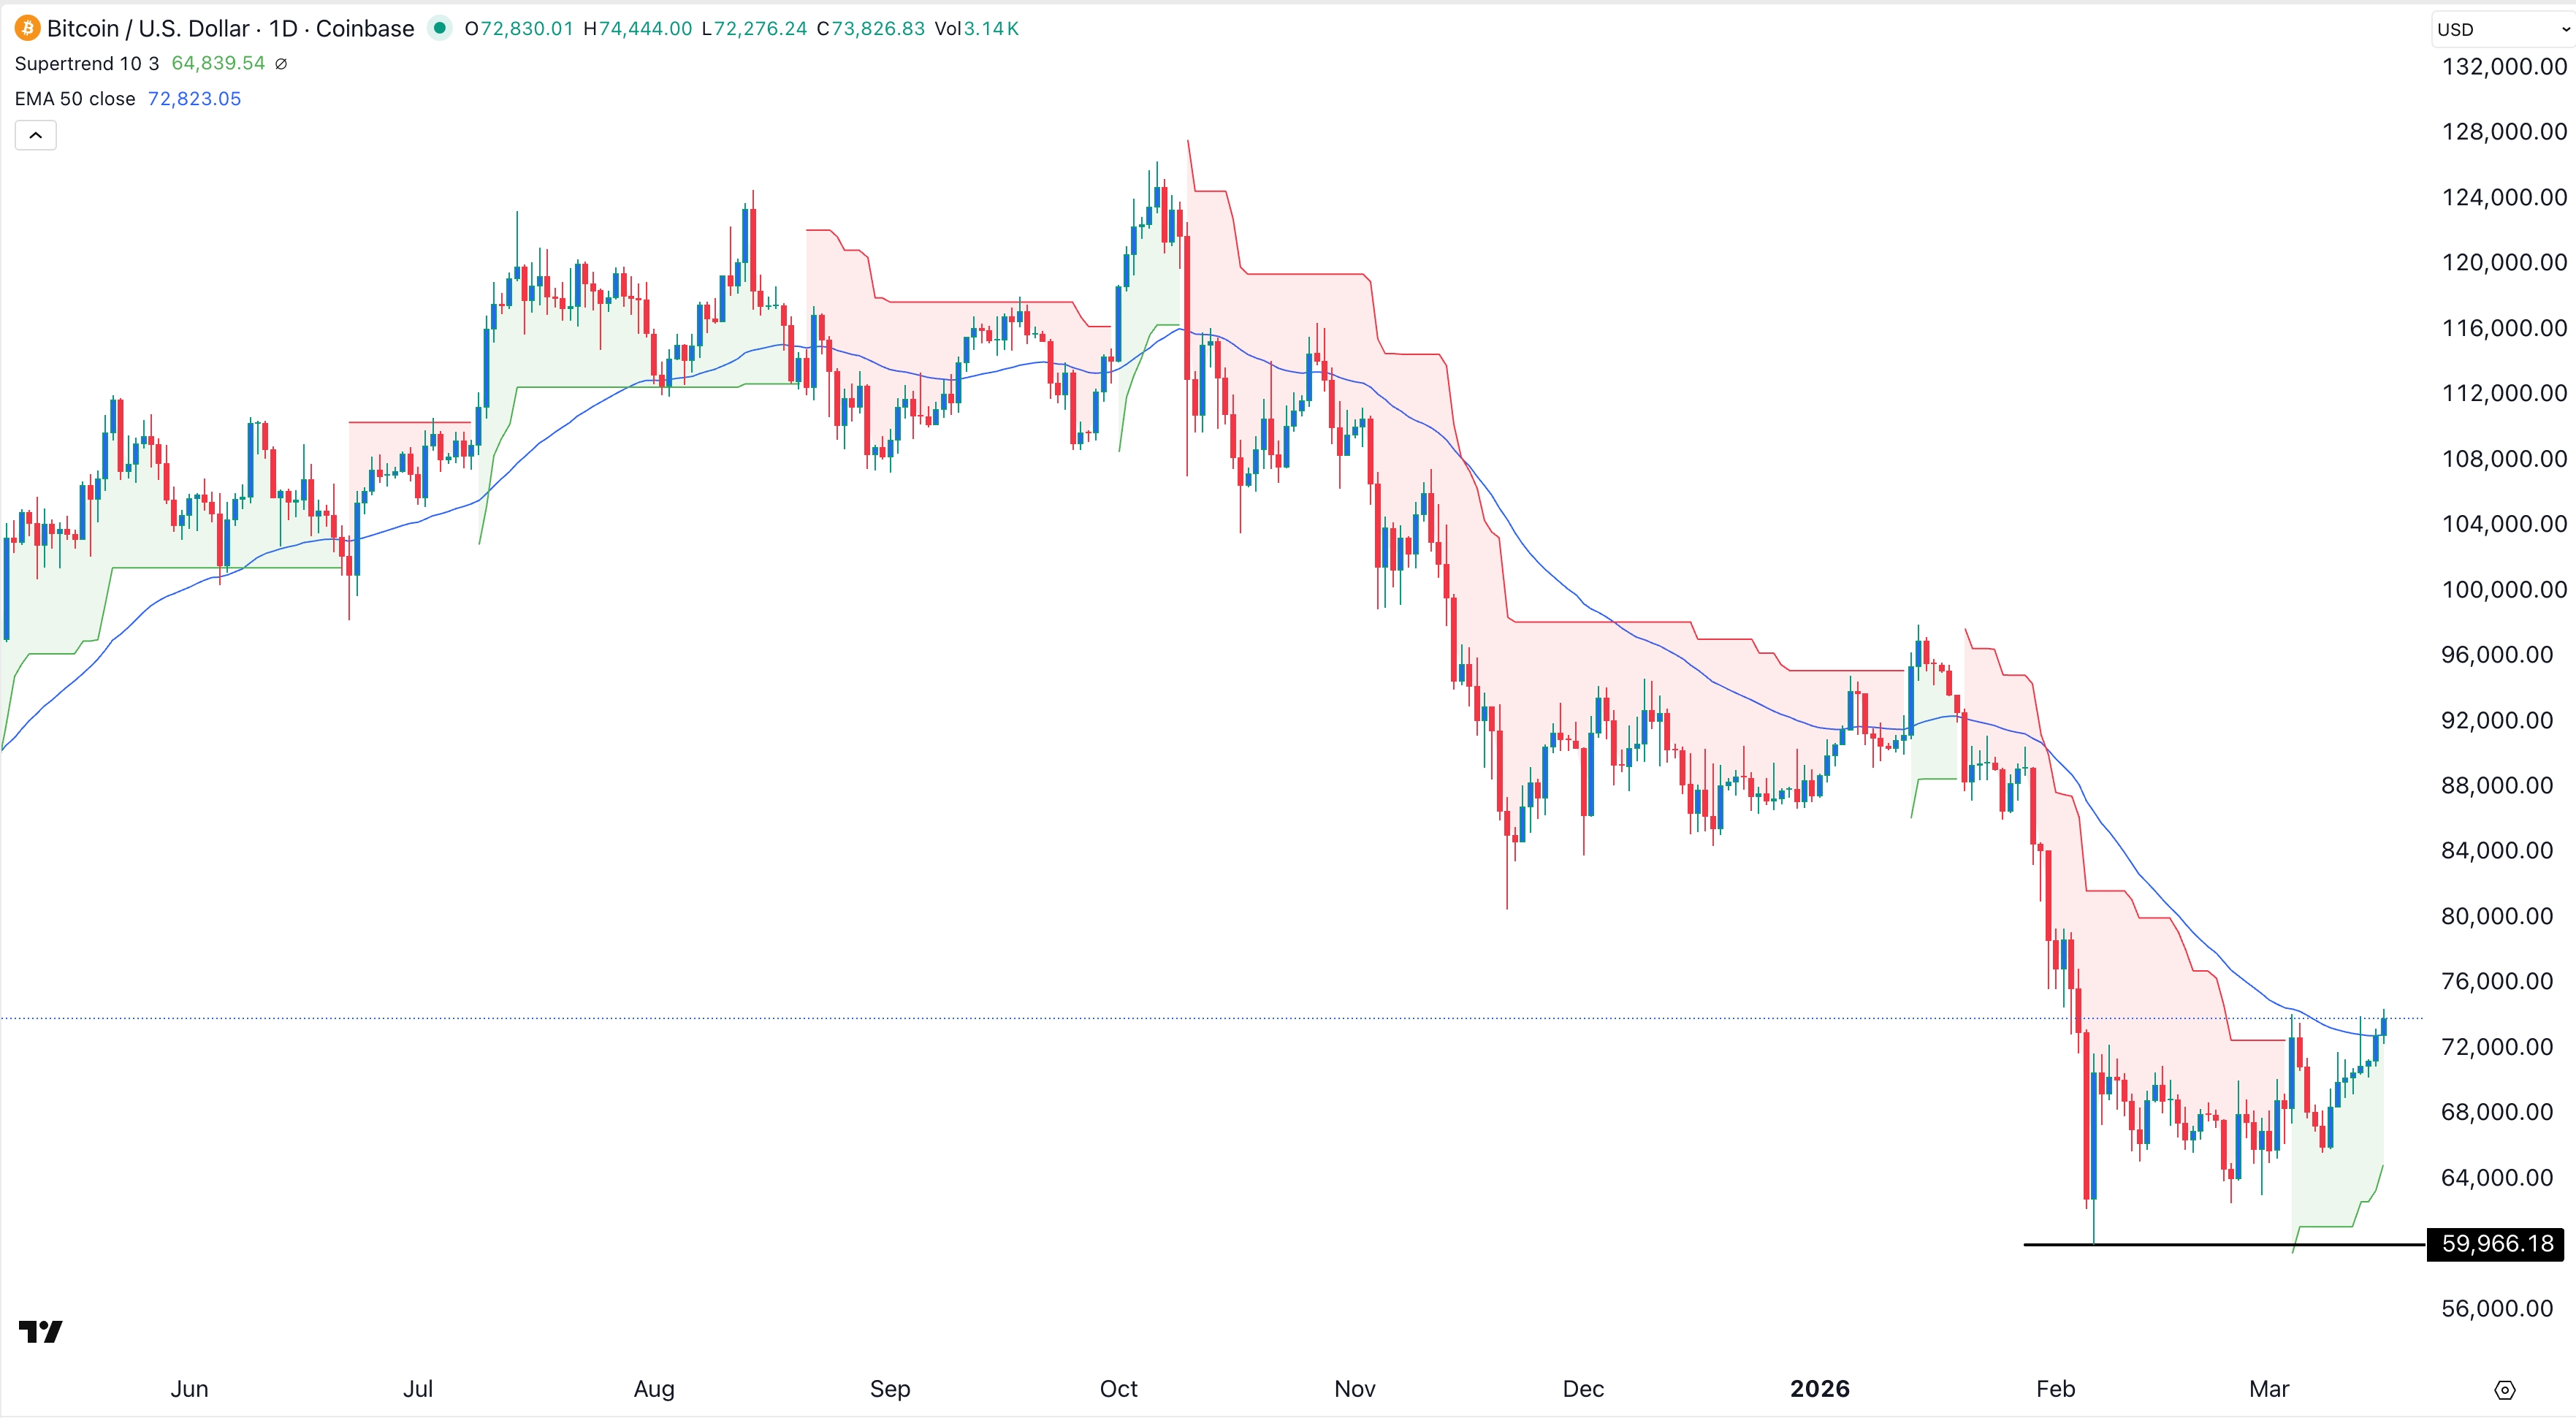
The daily timeframe chart shows that the BTC/USD pair bottomed at 60,000 earlier this year and has now rebounded to 74,000. It formed a double-bottom pattern, a common bullish reversal sign in technical analysis.
Bitcoin is now nearing the neckline at 76,065, its highest point in March this year and the neckline of this pattern. It is about to flip the Supertrend indicator from red to green. It has also jumped above the 50-day Exponential Moving Average (EMA).
The Relative Strength Index (RSI) has jumped and is nearing the overbought level of 70. Also, the Klinger indicator has continued rising in the past few months.
Therefore, Bitcoin price will likely continue rising in the near term, with the next key target being the psychological level at $80,000.