
Bearish view
Sell the BTC/USD pair and set a take-profit at 60,000.
Add a stop-loss at 71,000.
Timeline: 1-2 days.
Bullish view
Buy the BTC/USD pair and set a take-profit at 71,000.
Add a stop-loss at 60,000.
Bitcoin price rose modestly, mirroring the performance of the American stock market, which soared by over 2%. The BTC/USD pair rose to 68,000 from this week's low of 66,000. It remains in a bear market after falling by 46% from its highest point in October last year.
Bitcoin Price Rises as Risk-On Sentiment Prevails
The BTC/USD pair wavered as investors embraced a risk-on sentiment. For example, the Dow Jones Index rose by over 1,125 points, while the S&P 500 and Nasdaq 100 soared by 185 and 795 points, respectively. Crude oil retreated, with Brent and West Texas Intermediate (WTI) dropping to $103 and $101, respectively.
The surge happened after media reports suggested that Donald Trump was exasperated with the war and was considering an exit. He has told his associates that he was angry with NATO for not helping the US reopen the Strait of Hormuz.
The soaring stock and crypto market continued rising after Iran’s president said that he was willing to handle the war diplomatically. However, gaps between the US and Iran have remained wide in the past few days, with Iran asking for reparations and guarantees that the US will not attack it again.
Bitcoin price also held steady as spot Bitcoin ETFs continued adding assets. Data shows that spot Bitcoin ETFs added over $1.2 billion in assets in March, a big reversal after losing assets in the previous four consecutive months.
More data shows that the futures open interest has continued rising in the past few days, moving to $45 billion on Wednesday morning.
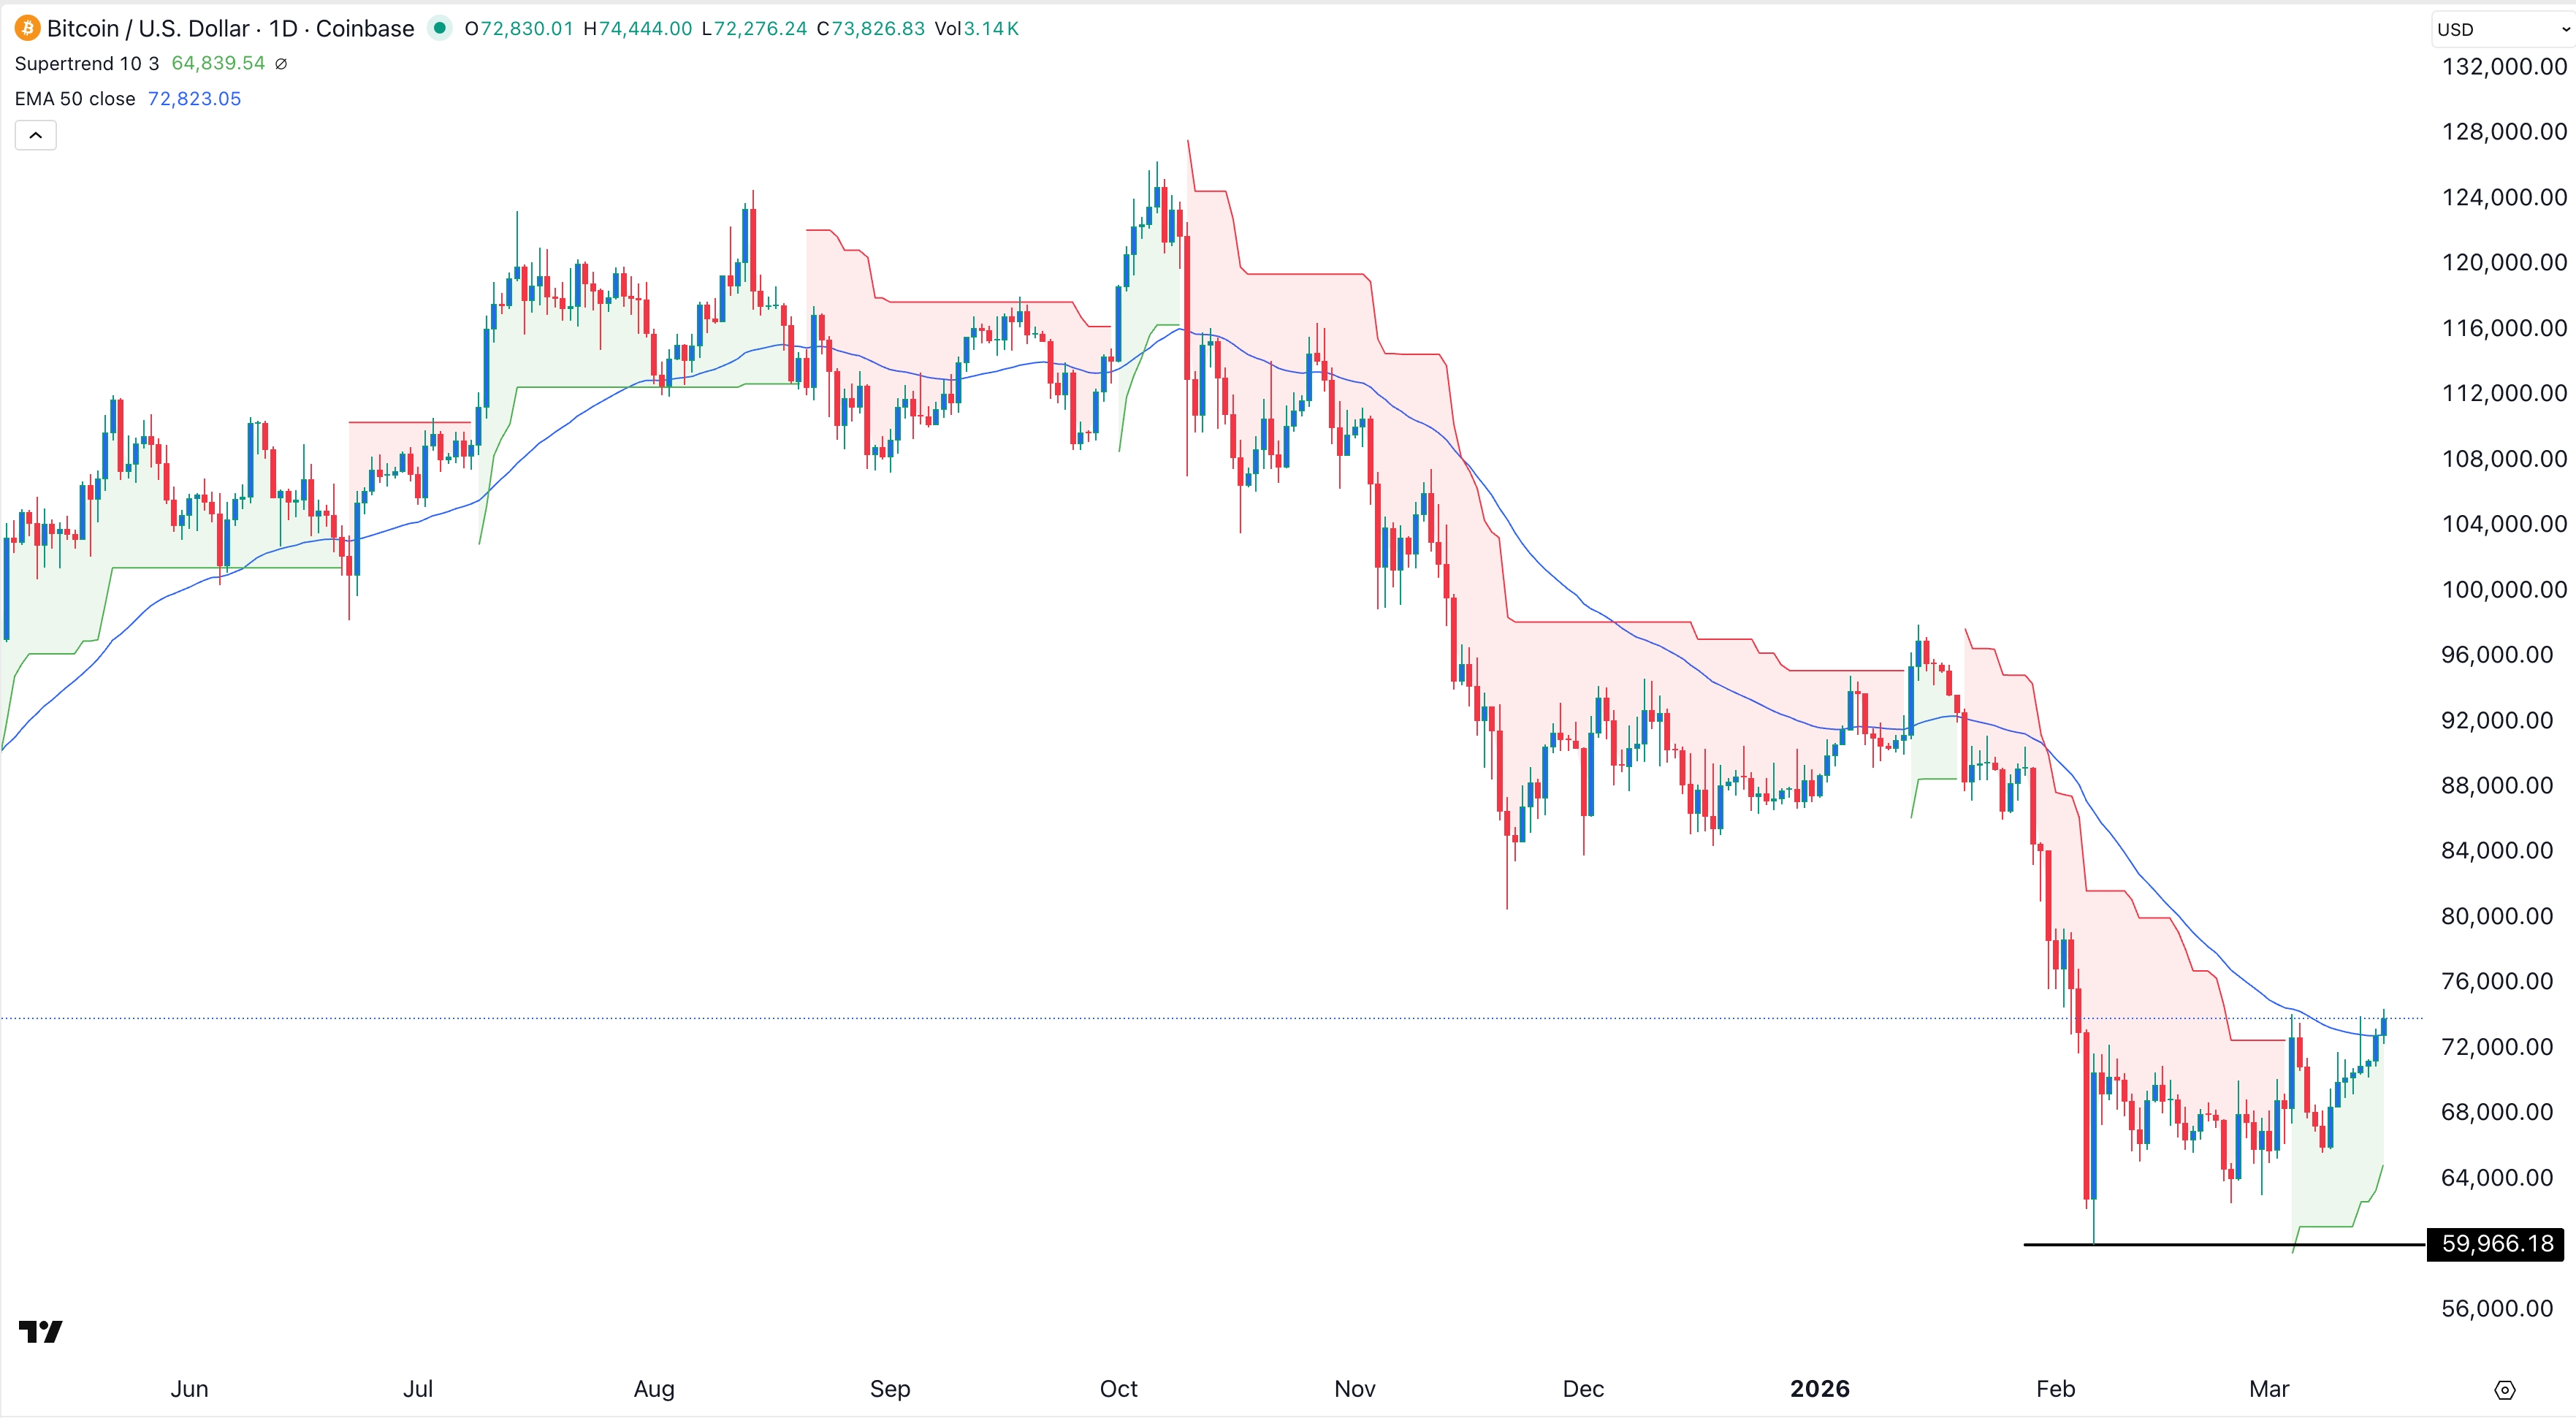
BTC/USD Technical Analysis
The three-day timeframe chart shows that the BTC/USD pair has remained into a bear market after falling by nearly 50% from its highest point in October. It has remained below all moving averages.
A closer look shows that the pair has formed a bearish flag pattern, which is made up of a strong freefall and a rising channel. This pattern often leads to a strong bearish breakout.
The pair has remained below the Supertrend indicator, a sign that bears remain in control for now. It has moved below the Ultimate Support level of the Murrey Math Lines tool at 75,000.
The pair will likely have a strong bearish breakdown, potentially to the key support level at 60,000, its lowest level this year. A drop below that level will point to more downside, potentially to the psychological level at 50,000.