
With the MACD turning bullish from historic lows, spot Bitcoin ETFs pulling in nearly $1 billion in fresh capital, and a classic cup-and-handle pattern forming, the stage is set for what analysts call a potential “explosive upward” move.
MACD's "Buy" Signal Forecasts a Massive BTC Price Move
The weekly Moving Average Convergence Divergence (MACD) indicator has just produced a bullish crossover after reaching its lowest level in Bitcoin’s entire history.
The MACD is a popular momentum indicator used in technical analysis that helps traders identify the strength, direction and duration of a trend of an asset’s price.
This is the same momentum signal that has historically marked past bear market bottoms and preceded some of the largest rallies in BTC’s 15-year history.
Previous instances show that Bitcoin tends to rise sharply when the MACD line (blue) crosses above the signal line (orange). The last time this happened was at the bottom of the 2022 bear market, which preceded a 376% increase in BTC price, as shown in the chart below.
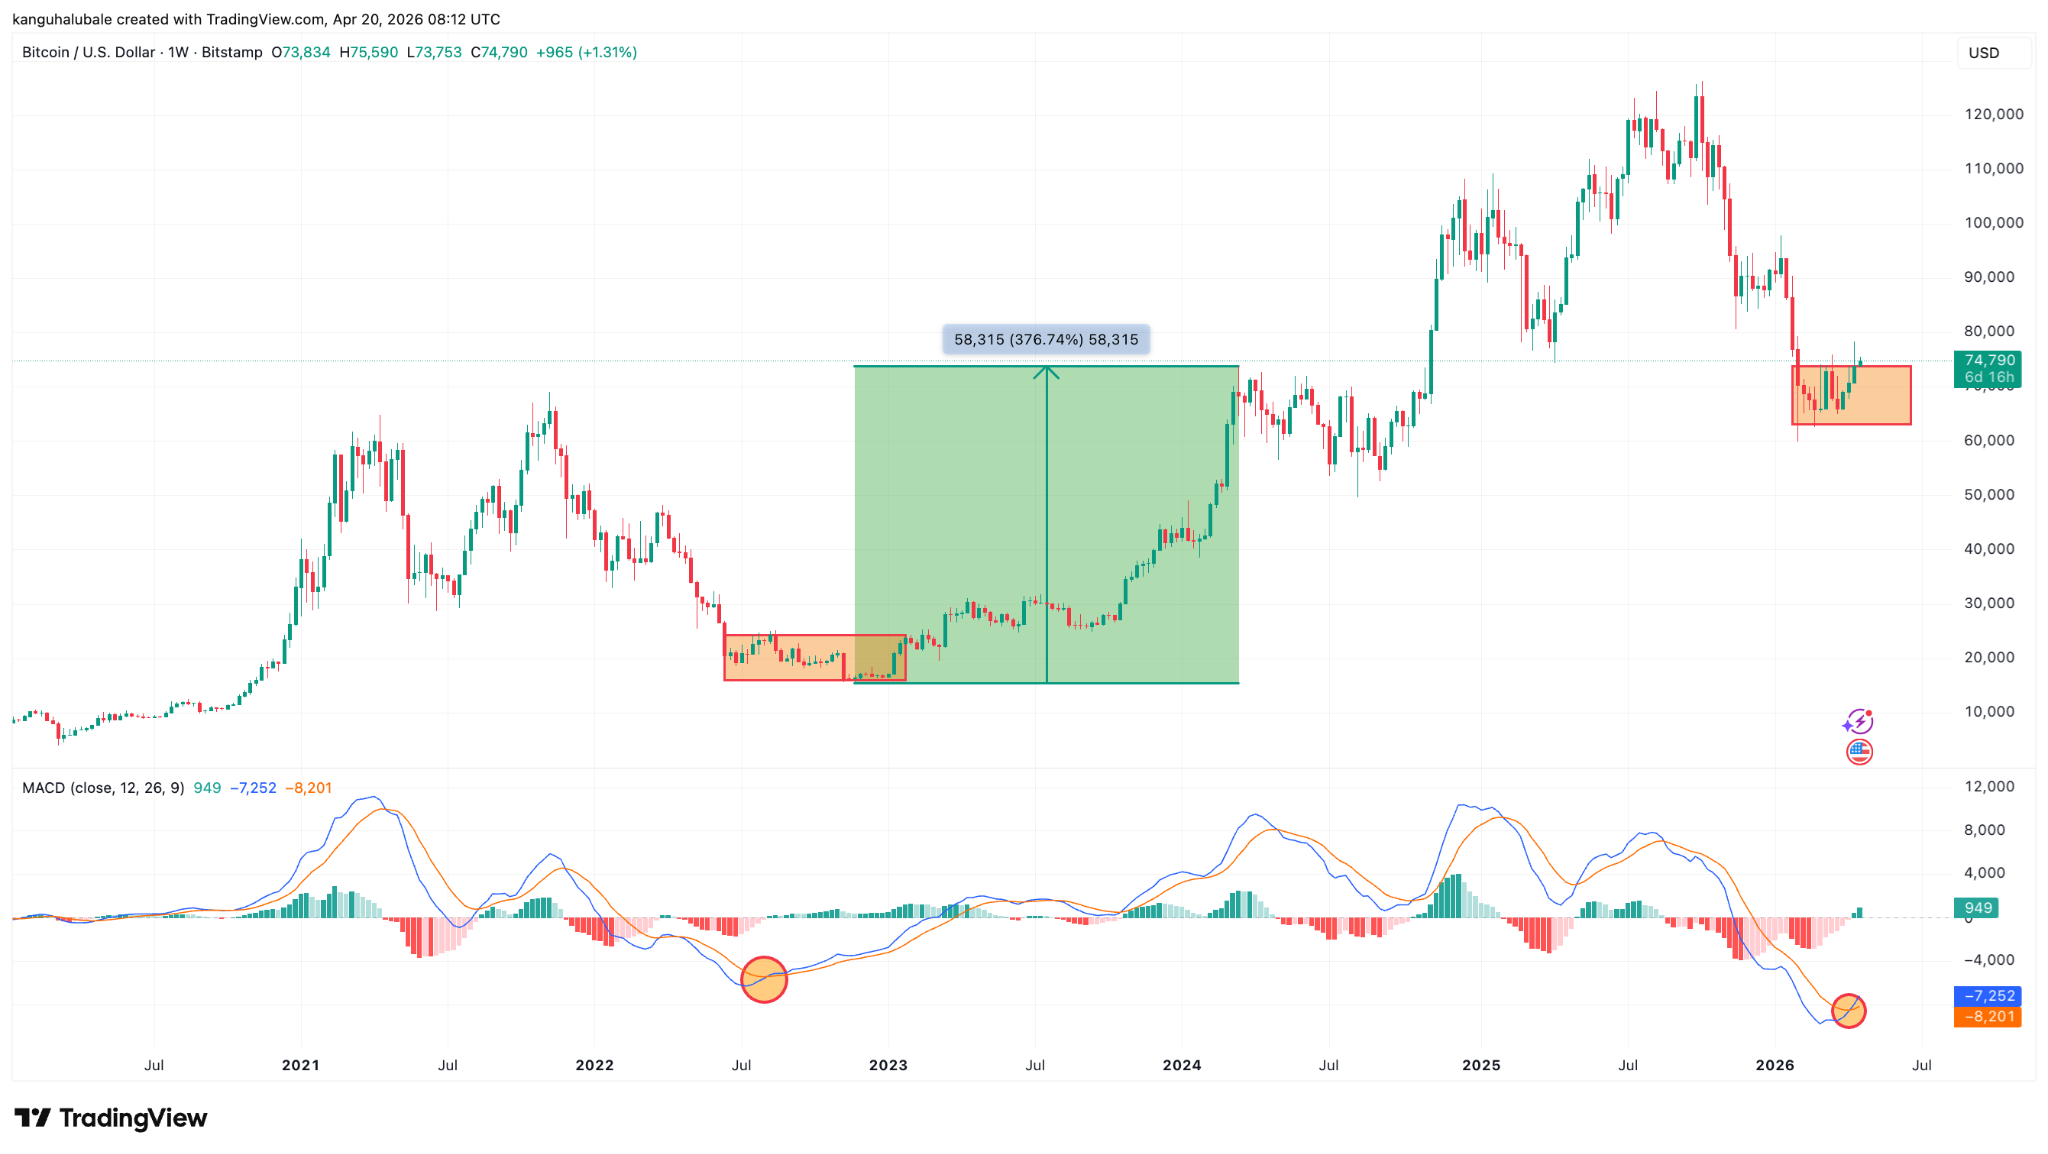
BTC/USD weekly chart. Source: TradingView
According to on-chain analytics shared by TheChartReport, this specific weekly MACD bullish cross has “historically produced a 93% win rate with a median 12-month return of +195%.”
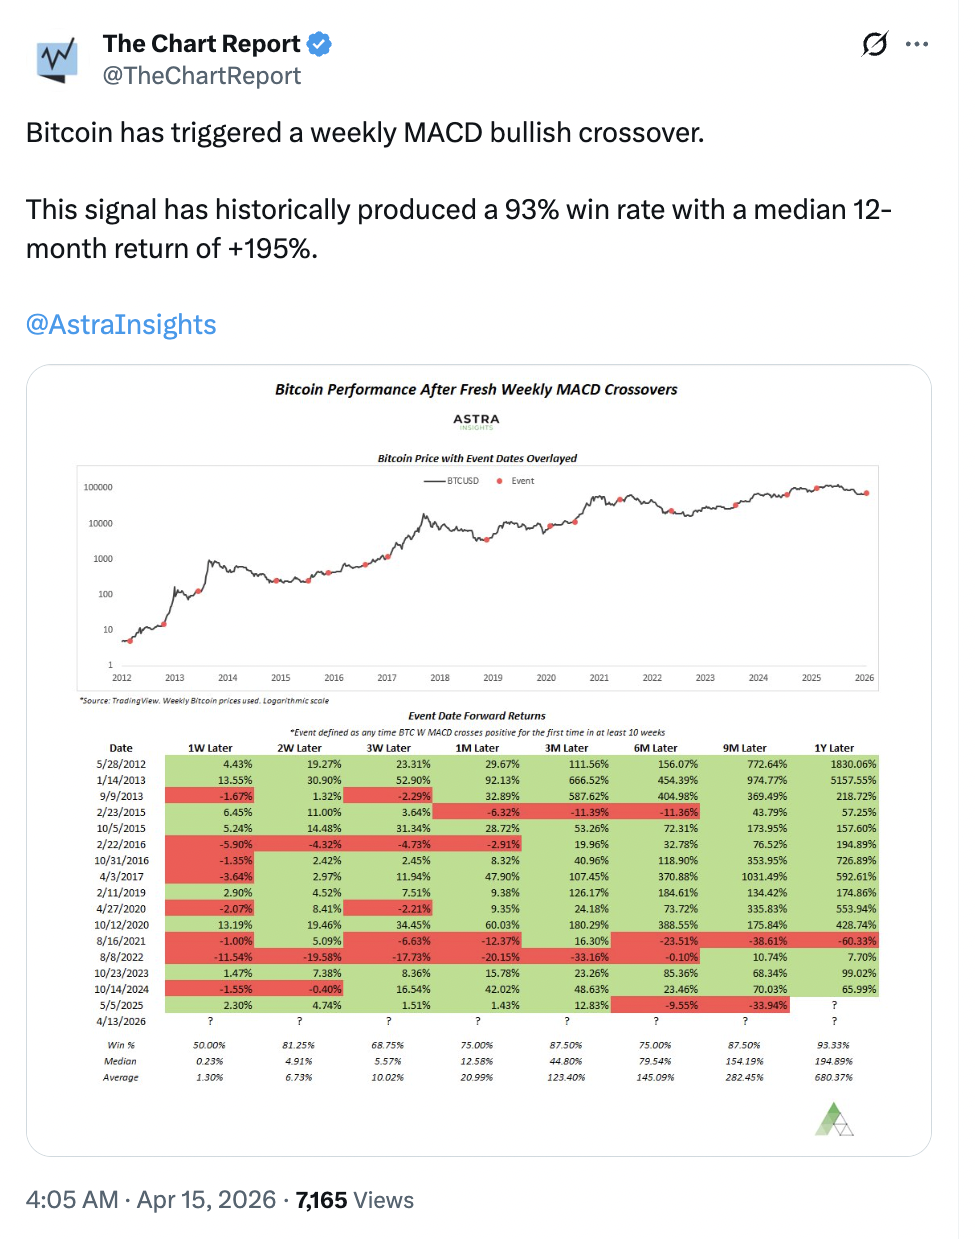
Source: The Chart Report
Looking back in 2015 as Bitcoin bottomed near $200 after a brutal 85% drawdown, the weekly MACD line crossed above the signal line while the histogram expanded positively. That setup launched the legendary rally that carried BTC to nearly $20,000 by late 2017, gains exceeding 9,000% from the cycle low.
A similar crossover appeared in early 2019 after the 2018 crash; price subsequently climbed more than 300% within 18 months.
Even in 2022–2023, early MACD signals, though not from absolute historic lows, preceded the 2024 recovery that pushed Bitcoin past $100,000.
With Bitcoin trading in a consolidation phase after recent volatility, this MACD flip suggests the bearish pressure is easing and a multi-month upward move could be underway.
Market participants watching the MACD’s histograms for continued expansion see confirmation that the 380%-style surge from the last identical signal may be repeating itself.
Inflow Into Spot Bitcoin ETFs Back BTC's Upside
Institutional appetite is reinforcing the technical buy signal. Spot Bitcoin ETFs recorded nearly $1 billion in net inflows last week, the strongest weekly total in more than three months, according to Farside Investors.
The week featured four consecutive positive inflow days after an initial Monday outflow, with Friday alone delivering $663.9 million. BlackRock’s iShares Bitcoin Trust (IBIT) led the charge with $284 million in net inflows, underscoring renewed risk-on sentiment amid easing geopolitical tensions.
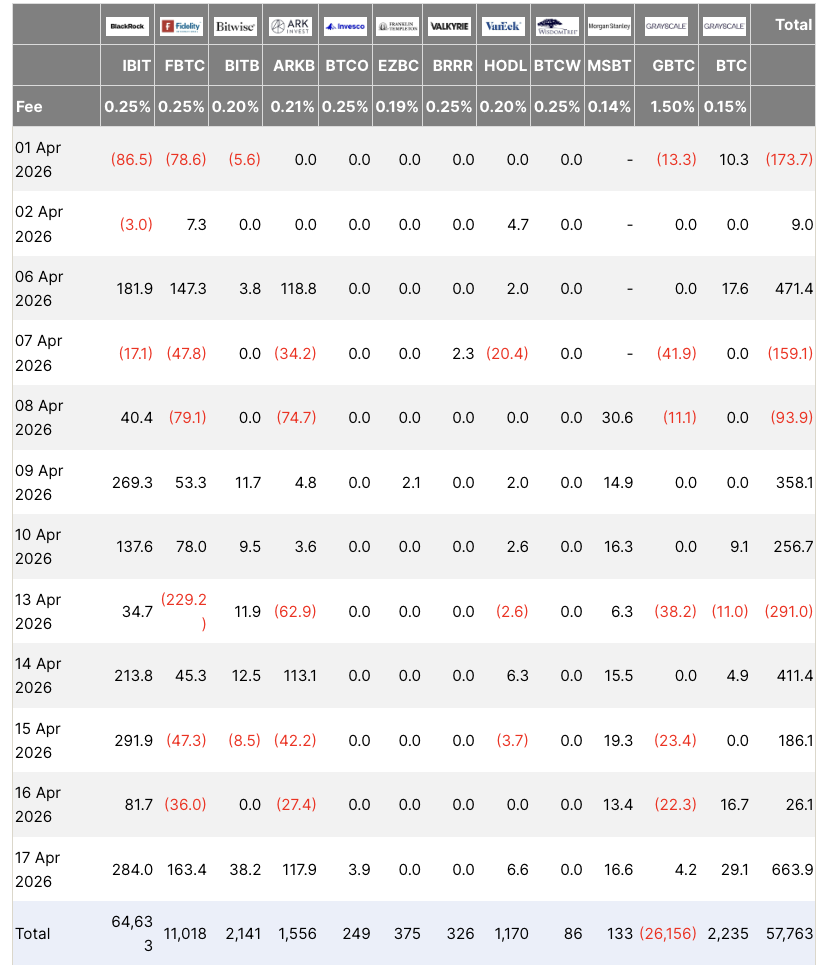
Spot Bitcoin ETF flows table. Source: Farside Investors
History shows such ETF inflow surges have reliably preceded major BTC price rallies. When U.S. spot Bitcoin ETFs first launched in January 2024, initial weeks of $1–$2 billion inflows coincided with Bitcoin’s 67% climb from $40,000 toward its previous all-time high of $73,800, reached in March 2024.
Later streaks of sustained inflows in mid-2025 helped propel BTC to its current all-time high above $126,000.
Analysts highlight that weekly inflows near or above $1 billion have consistently acted as a “demand floor,” absorbing selling pressure and fueling breakouts.
With total assets under management in spot Bitcoin ETFs climbing rapidly, this fresh $996 million wave mirrors the capital rotations that powered previous legs higher. As risk sentiment improves and inflows accelerate, the technical MACD signal gains fundamental backing, creating a powerful tailwind for upside continuation.
Bitcoin's Cup and Handle Chart Targets $90,000
The BTC/USD price action itself is painting a classic bullish reversal chart pattern in the eight-hour time frame.
This is a cup-and-handle (C&H) pattern, signaling that an uptrend is likely to resume with a potential breakout, after the latest drawdown that saw BTC price bottom below the $60,000 level.
The measured target of the pattern, calculated by adding the cup’s depth to the breakout point above the handle’s resistance at $76,000, points squarely to $89,000, a 19% uptick from the current price.
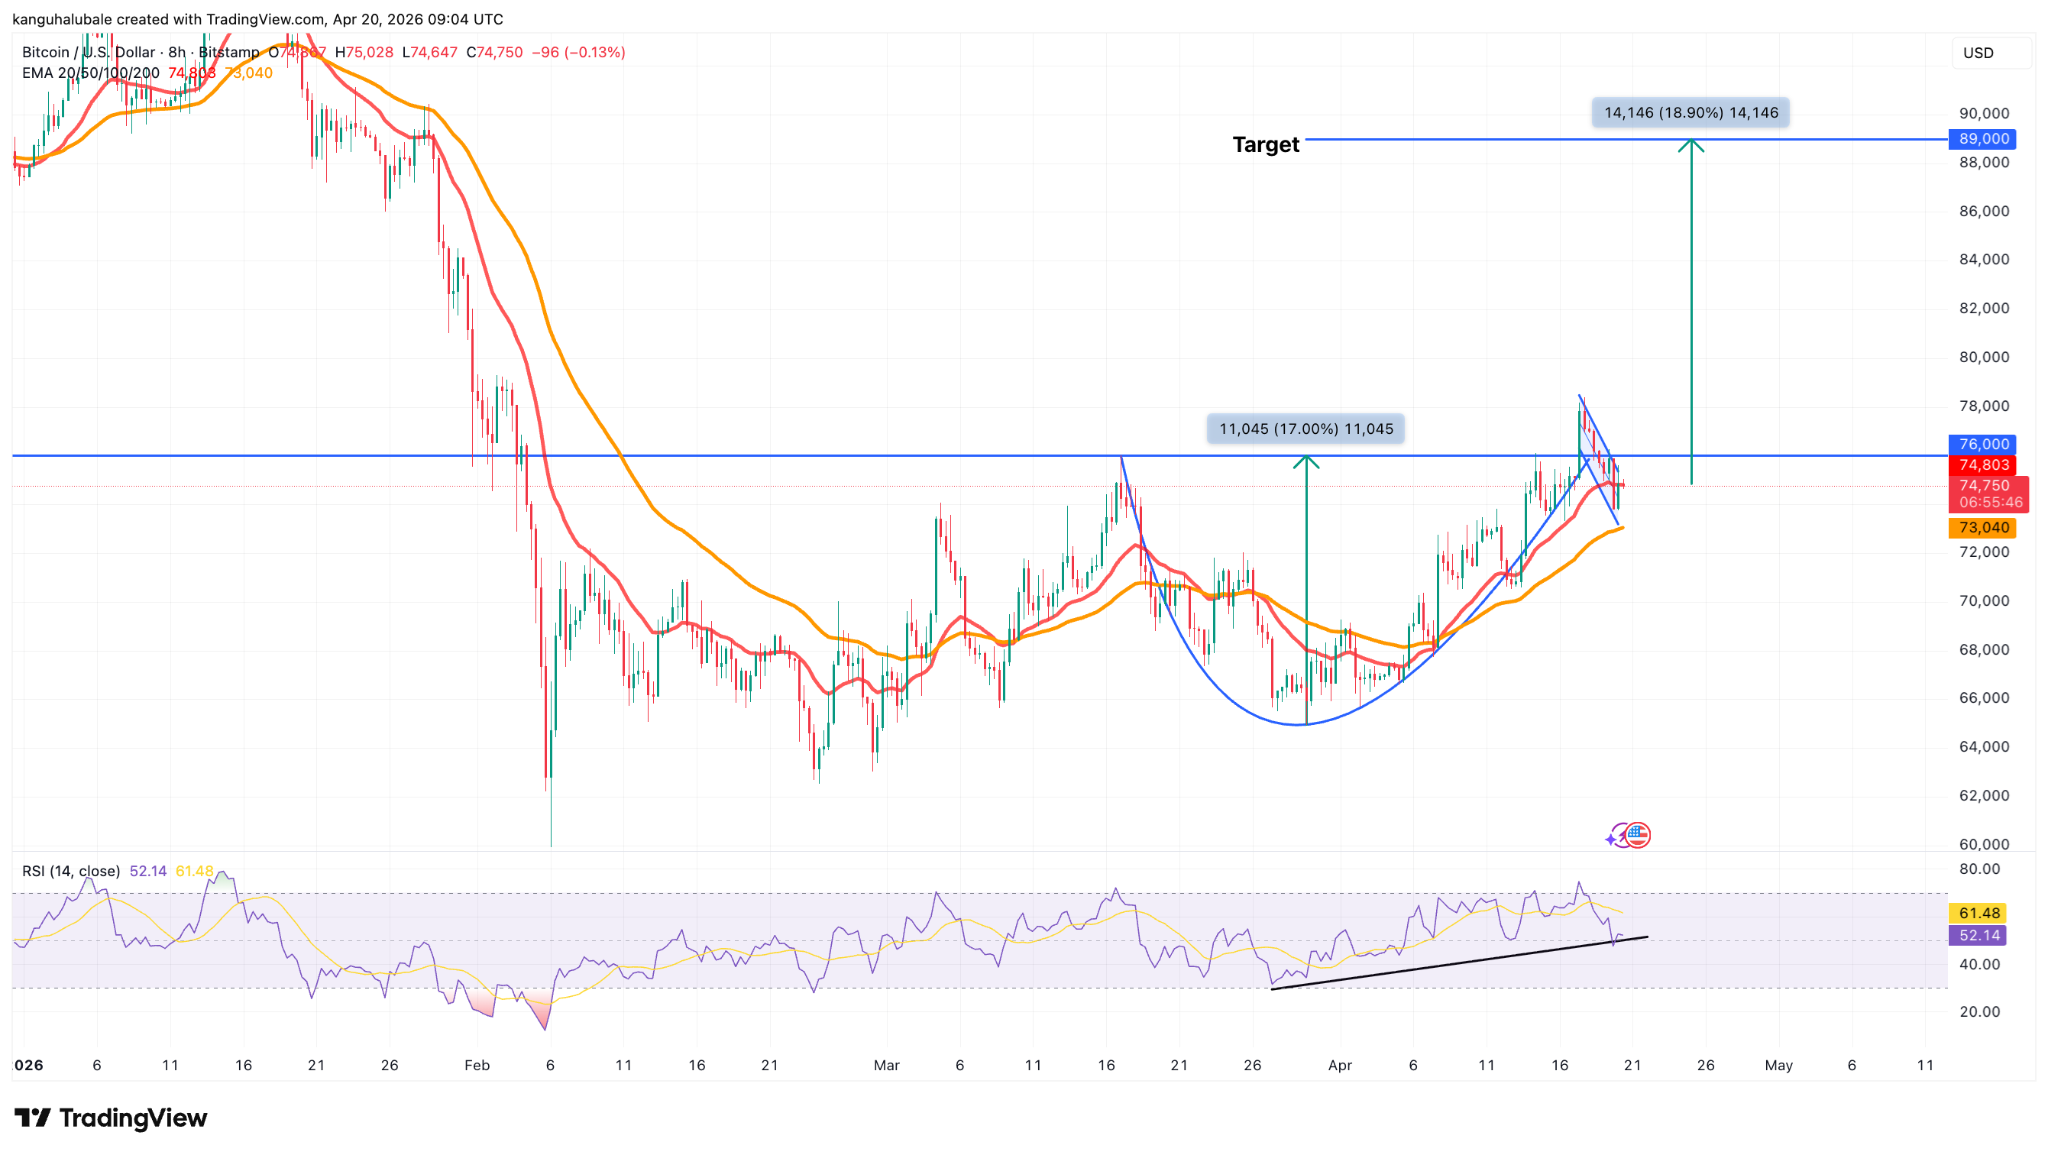
BTC/USD 8-hour chart. Source: TradingView
The relative strength index improved from oversold conditions of 29, reached on March 26, to 52, suggesting that the bullish momentum has been steadily building up.
My Take
When combined with the MACD crossover and ETF inflows, the cup-and-handle pattern sets BTC up for a massive upward move.
Sustained ETF buying provides the fuel needed to push through overhead supply, while the pattern’s measured objective aligns with historical resistance zones that previously capped rallies.
Ready to trade our free signals? Here is our list of the best MT4 crypto brokers worth reviewing.