
Bullish view
Buy the AUD/USD pair and set a take-profit at 0.7250.
Add a stop-loss at 0.7100.
Timeline: 1-2 days.
Bearish view
Sell the AUD/USD pair and set a take-profit at 0.7100.
Add a stop-loss at 0.7250.
The AUD/USD exchange rate rose on Tuesday as market participants positioned themselves for the upcoming Australian consumer inflation report and the Federal Reserve interest rate decision. It was trading at 0.7185, up slightly from last week’s low of 0.7112.
Australian Inflation Data and FOMC Decision
The AUD/USD exchange rate rose ahead of a busy market week in which Australia will publish the latest consumer inflation report on Wednesday. This report will provide more information about the economy and hints of what to expect in the upcoming meetings.
Economists expect the report to show that Australia’s inflation remained at an elevated level in March as energy prices surged. The average estimate is that the headline CPI surged from 3.7% in February to 4.7% in March. The trimmed and weighted mean inflation figures are expected to come in at 3.4% and 3.5%.
These numbers mean that the RBA will maintain its hawkish tone in the coming meetings as it has done in the past few meetings. It has delivered two interest rate hikes, and analysts expect it to either hike or maintain the status quo.
The AUD/USD pair will also react to the upcoming US macro data, including the house price index and the consumer confidence report. Economists expect the report to show that consumer confidence slipped to 89.2 in April from the previous 91.8.
The most important catalyst for the pair will be the upcoming Federal Reserve interest rate decision, which will come out on Wednesday. Economists polled by Reuters expect the bank to leave rates unchanged between 3.50% and 3.75%. Officials will likely maintain the option of hiking interest rates later this year if inflation continues rising.
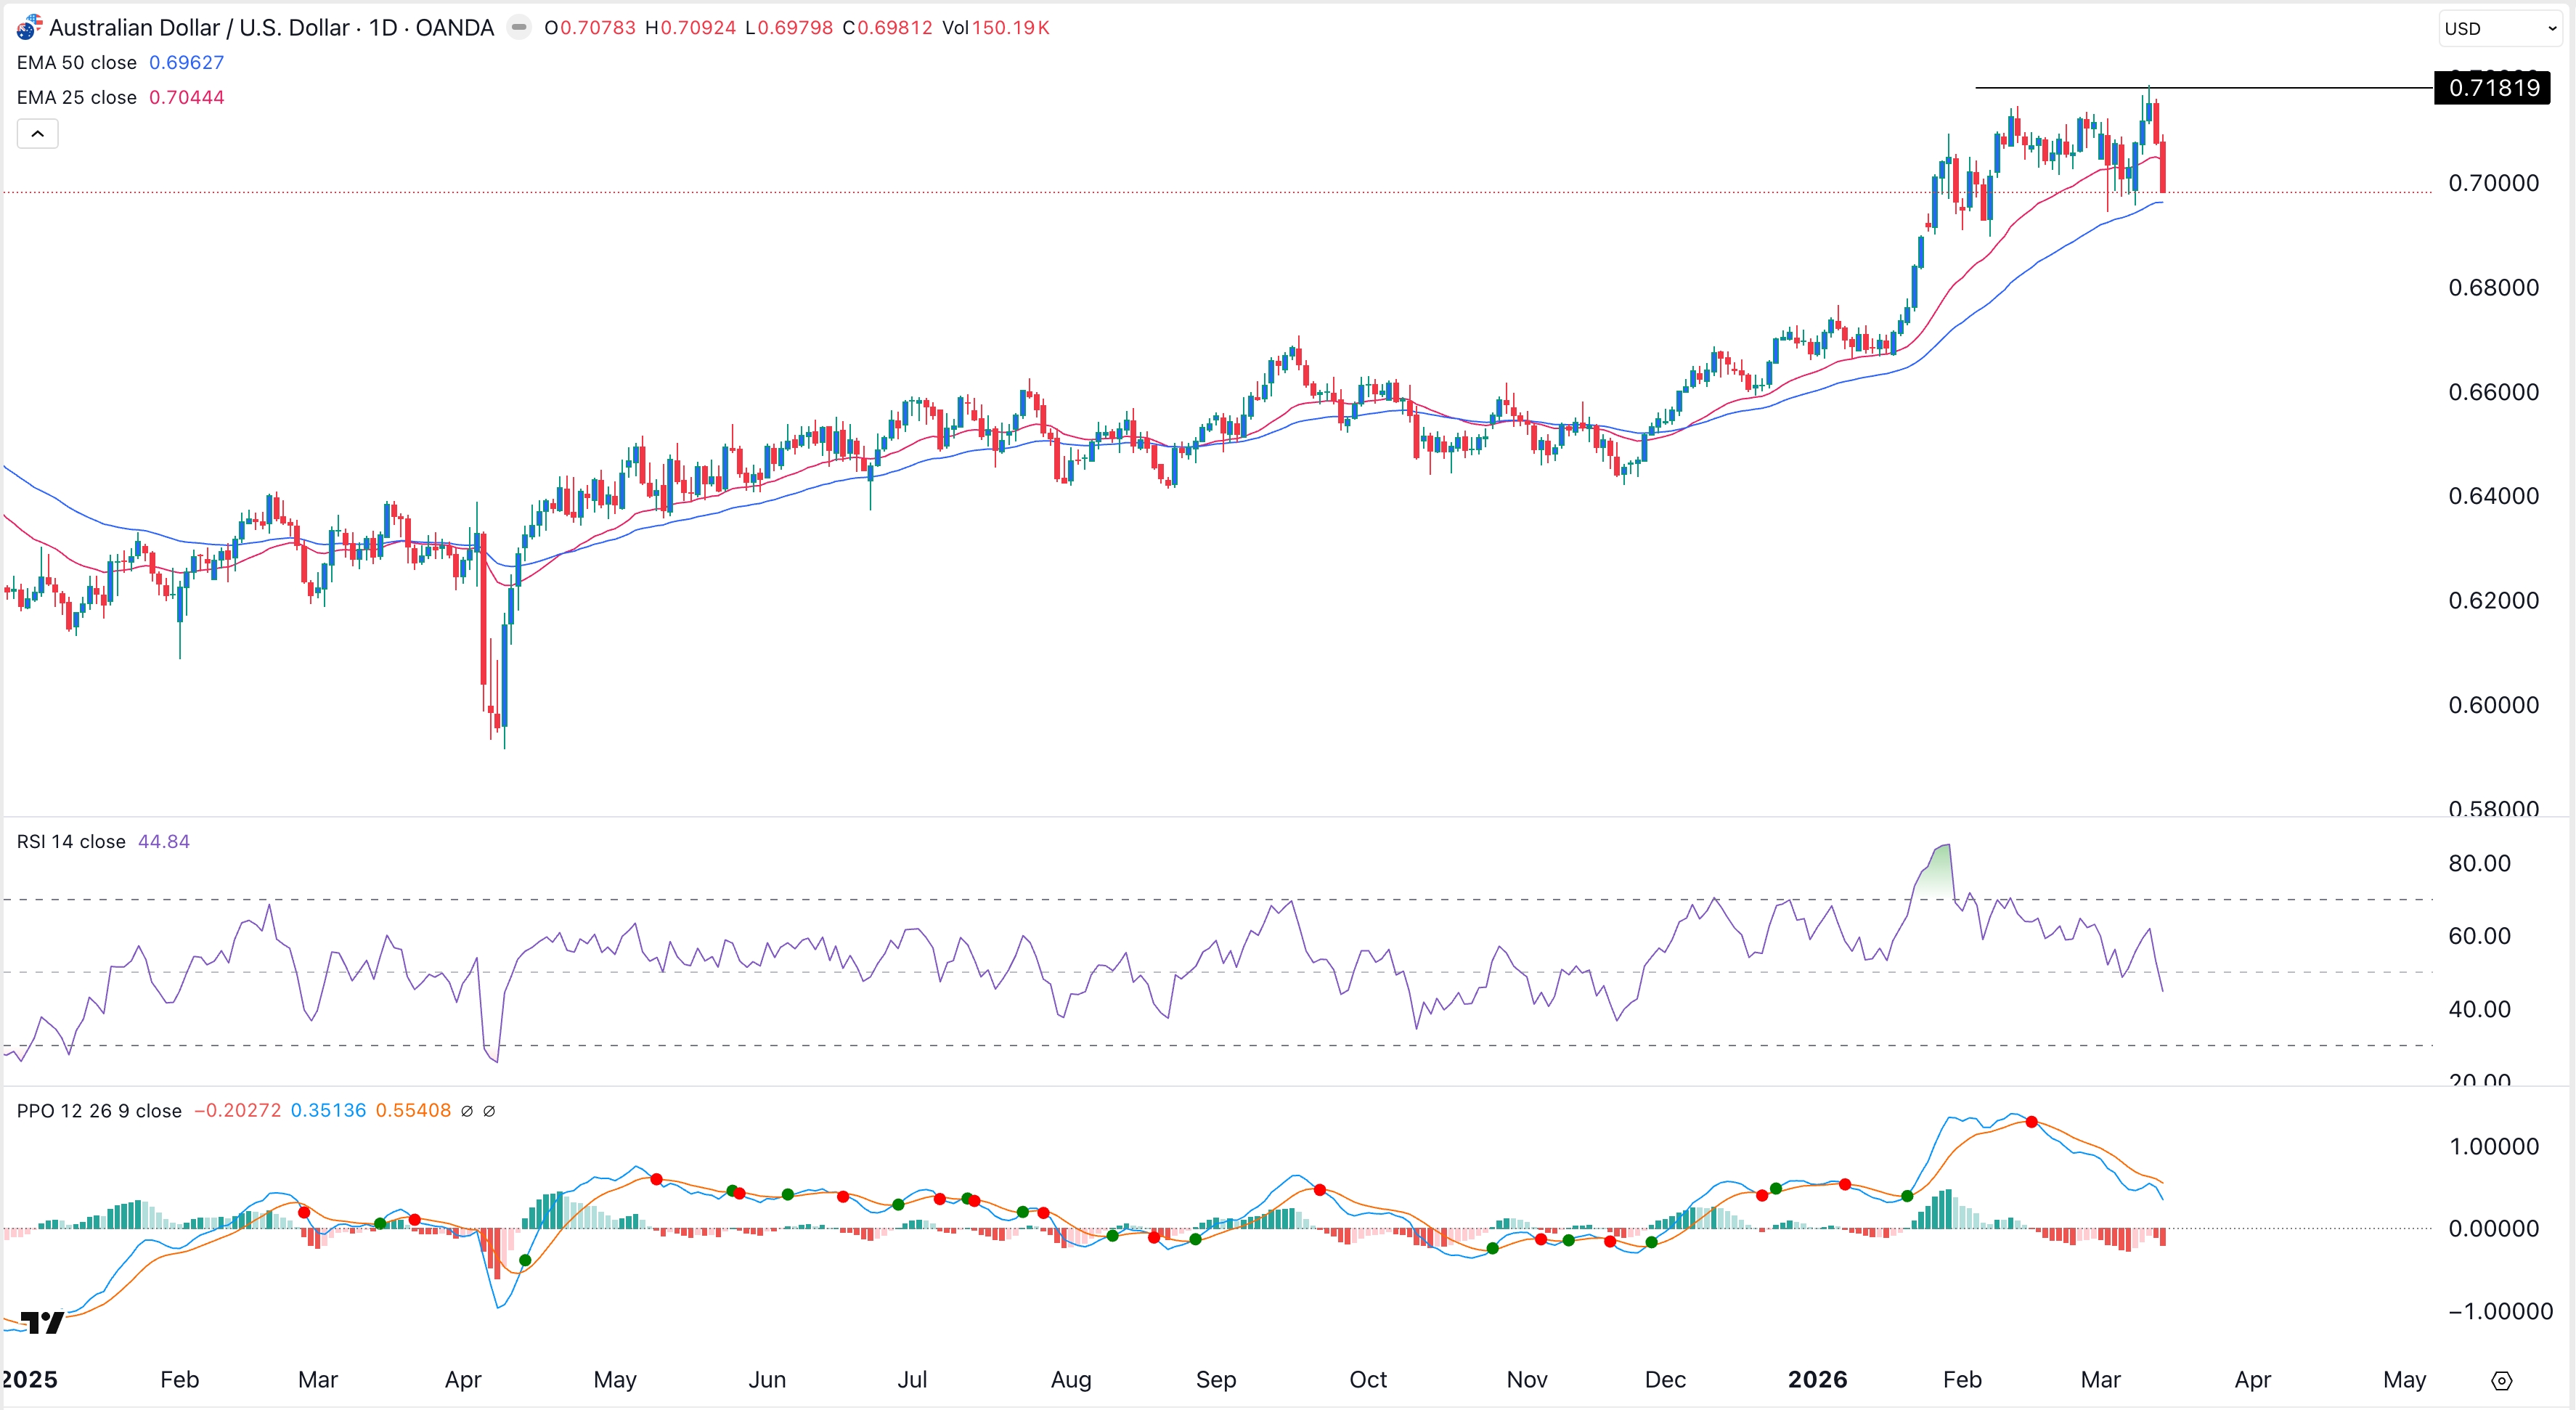
AUD/USD Technical Analysis
The daily timeframe chart shows that the AUD/USD pair has been in an uptrend in the past few months and is now hovering near its highest point this year. This price is important as it has failed to move several times since March 11.
It has remained above the 50-day Exponential Moving Average (EMA) and the Supertrend indicator. Also, there are signs that it has formed either an inverted head-and-shoulders or a double-top pattern.
As such, a move above the year-to-date high of 0.7220 will confirm the bullish outlook and point to more gains, potentially to the key resistance level at 0.7250. On the other hand, a move below the support at 0.7100 will invalidate the bullish outlook.