
Short Trade Idea
Enter your short position between $147.20 (yesterday’s intra-day low) and $151.50 (an intermediate horizontal resistance level).
Market Index Analysis
l 3M Company (NYSE:MMM) is a member of the Dow Jones Industrial Average Index, the S&P 100 Index, and the S&P 500 Index.
l All three indices are recording lower highs and lower lows, hinting at further potential weakness.
l The Bull Bear Power Indicator for the S&P 500 Index is retreating from extreme bullish conditions, confirming this week’s sell-off.
Market Sentiment Analysis
Equity futures point to a bullish start this morning after US President Trump extended the ceasefire with Iran, citing a seriously fractured Iranian government, while Iran criticized the talks as a waste of time amid the US's lack of commitment to previous deals. The Senate hearing to confirm Kevin Warsh as the next Fed chair is ongoing, while earnings from Tesla, AT&T, and Boeing are scheduled for today.
3M Company Fundamental Analysis
3M Company is an industrial conglomerate that supplies over 60,000 products to industrial clients, the transportation sector, the electronics industry, the worker safety market, and the consumer goods market. It has over 100,000 patents.
So, why am I bearish on MMM following its earnings release?
3M Company narrowly missed revenue expectations of $6.01 billion, reporting $6.00 billion, while earnings per share of $2.14 beat expectations of $1.98. The 1.4% decrease in organic sales is a significant red flag, while I remain bearish on weak consumer and industrial demand moving forward. The lack of margin expansion and growth catalysts is a further headwind, along with litigation stemming from over 15,000 personal injury lawsuits related to PFAS chemicals.
Metric | Value | Verdict |
P/E Ratio | 28.55 | Bearish |
P/B Ratio | 16.82 | Bearish |
PEG Ratio | 1.47 | Bullish |
Current Ratio | 1.59 | Bearish |
ROIC-WACC Ratio | Positive | Bullish |
The price-to-earnings (P/E) ratio of 28.55 makes MMM an expensive stock. By comparison, the P/E ratio for the S&P 500 Index is 25.64.
The average analyst price target for MMM is $175.26. It suggests excellent upside potential, but the downside risks are greater.
Top Regulated Brokers
3M Company Technical Analysis
Today’s MMM Signal
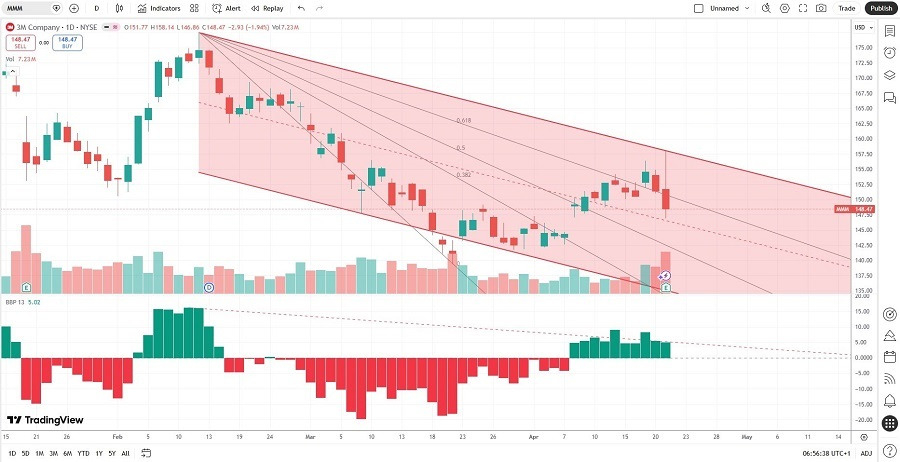
l The MMM D1 chart shows price action inside a bearish price channel.
l It also shows price action between its descending 50.0% and 61.8% Fibonacci Retracement Fan levels.
l The Bull Bear Power Indicator is in bullish territory with a descending trendline.
l The average bearish trading volumes are higher than the average bullish trading volumes.
l MMM corrected more than the S&P 500 Index, a bearish confirmation.
My MMM Short Stock Trade
l MMM Entry Level: Between $147.20 and $151.50
l MMM Take Profit: Between $119.31 and $121.98
l MMM Stop Loss: Between $160.97 and $164.23
l Risk/Reward Ratio: 2.03
Ready to trade our stock analysis of 3M? Here is our list of the best stock brokers worth reviewing.