
Ripple was trading at about $1.35 at the time of writing, the token now faces a realistic 40% slide to $0.80 if key support levels fail.
Geopolitical and Inflation Risks Suggest XRP Downside
The ongoing US and Israel war with Iran has dramatically reshaped the global economic landscape. Since its start on February 28th, the conflict has disrupted the Strait of Hormuz, stranding roughly 20% of global oil supply at times.
U.S. WTI crude oil prices surged past $97 per barrel, while Brent briefly topped $108, marking a 50%+ spike in weeks. Gasoline prices in the U.S. climbed nearly 25% to multi-year highs.
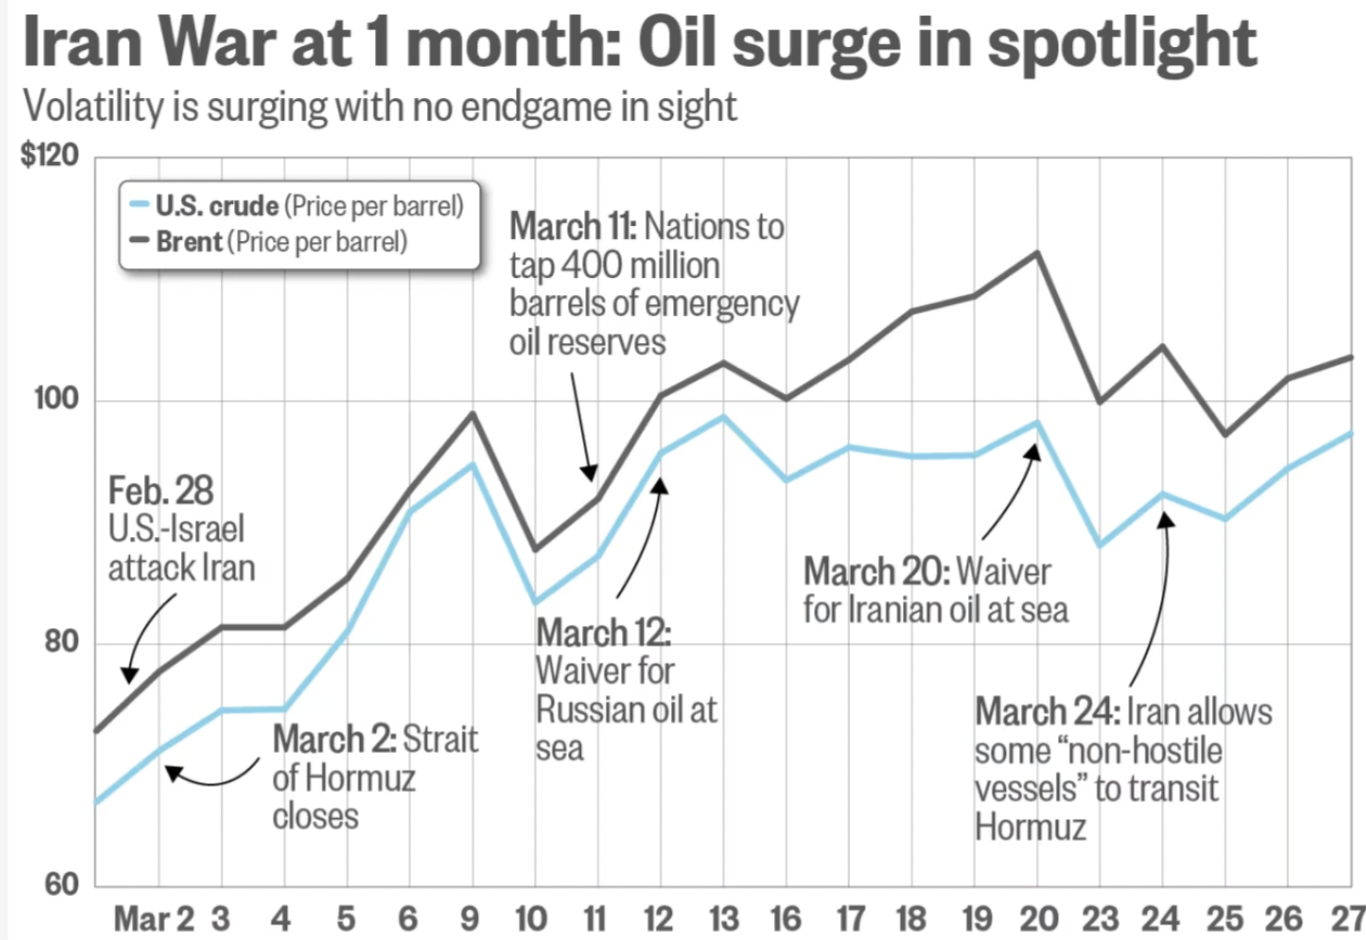
Crude Oil Prices During the Iran War. Source: Marketwatch
This energy shock is reigniting inflation fears. The headline consumer price index (CPI), already running hot above the Fed’s 2% target, now risks fresh upside from transport and manufacturing costs.
The Federal Reserve responded by holding rates steady at 3.50%–3.75% in its March 18–19 meeting—the first since the war began—explicitly citing “uncertainty” from Middle East oil disruptions.
Officials have dialed back rate-cut expectations, with traders now pricing in possible hikes later in 2026 if the oil shock persists.
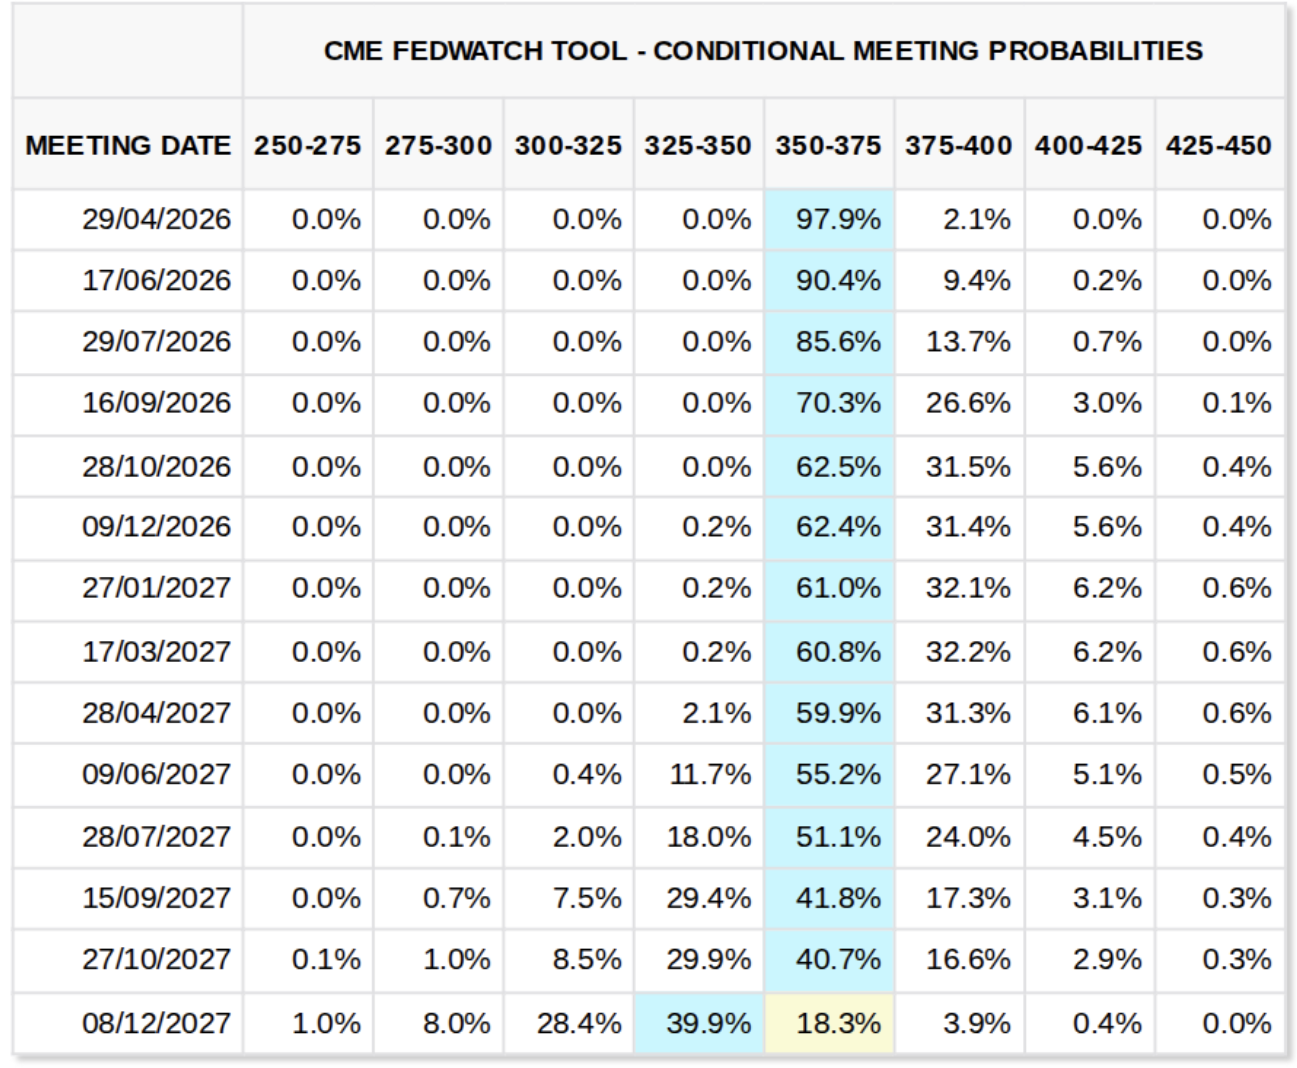
Federal Reserve target rate probabilities (screenshot). Source: CME Group FedWatch Tool
Higher-for-longer rates are toxic for risk assets like XRP. Crypto thrives on cheap liquidity and growth optimism. As such, rising inflation and hawkish policies tighten financial conditions, reduce investor appetite for speculative holdings, and push capital toward safer yields.
XRP, already sensitive to macro flows, has weakened alongside broader risk-off sentiment. Without rate relief, institutional and retail buyers stay sidelined, amplifying downside momentum for XRP price.
Reduced Inflows into Spot XRP ETFs
Spot XRP ETFs, approved and trading since late Nov. 14, 2025, initially drew strong institutional capital.
Cumulative inflows peaked at $1.44 billion by early January, lifting total AUM above $1.65 billion and locking up nearly 770 million XRP tokens.
However, March 2026 has seen a sharp reversal, with data showing only four net inflow days all month, with the funds recording $1.26 million in inflows on March 25. On March 26 and 27, all major funds, including those from Franklin Templeton and Grayscale, recorded zero or outright outflows.
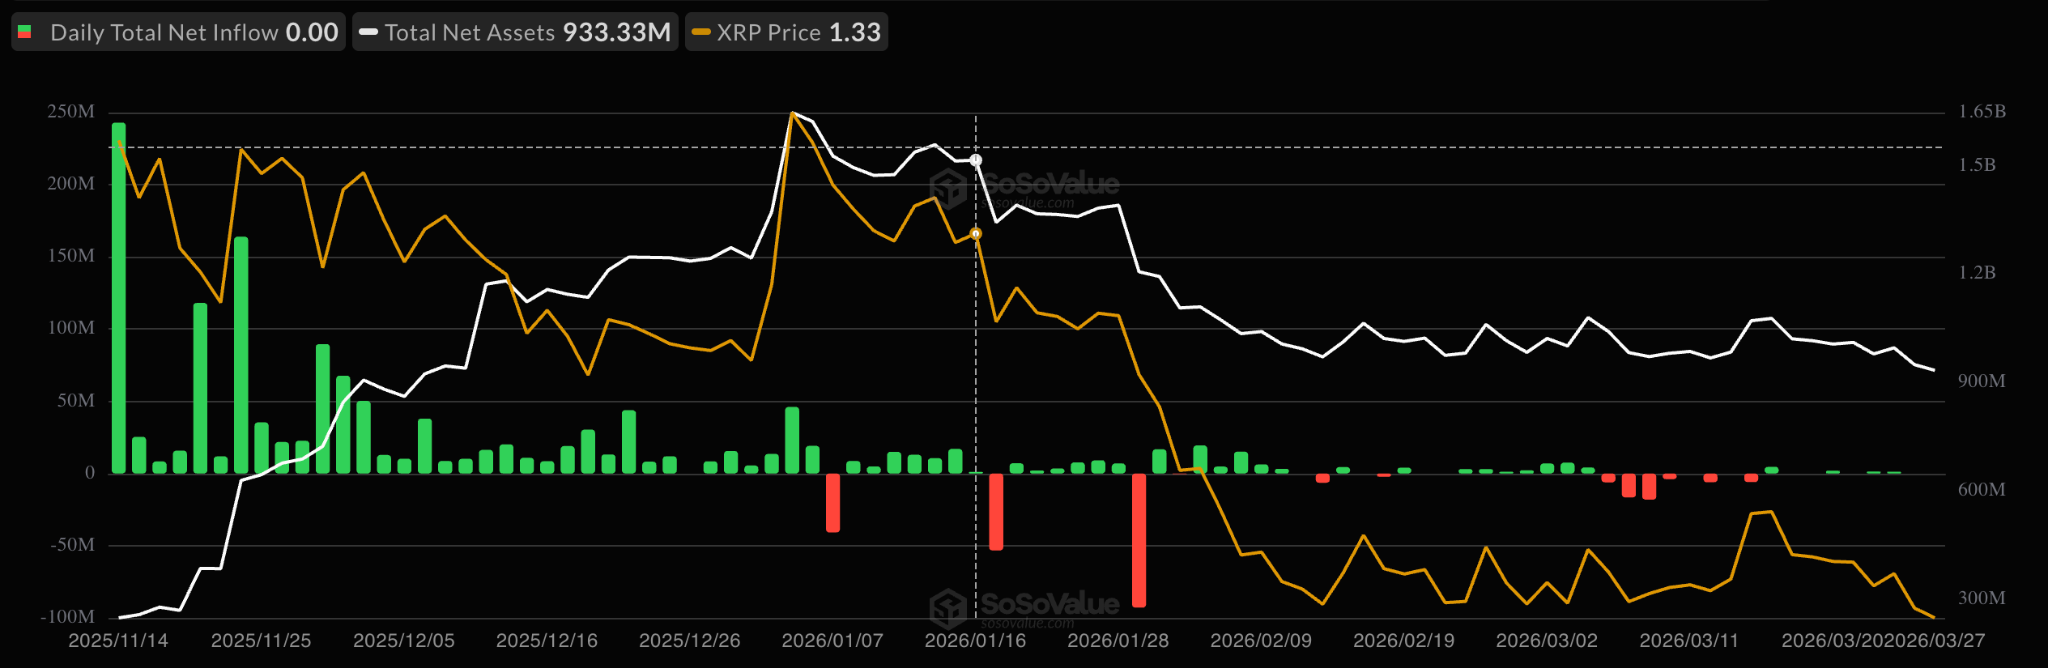
Spot XRP ETFs flows chart. Source: SoSoValue
This slowdown signals a waning institutional demand. Early enthusiasm, fueled by regulatory clarity and Ripple’s legal wins, has cooled as macro headwinds dominate.
Large players appear to be taking profits or hedging rather than adding exposure. Weekly net flows have turned negligible or negative in recent weeks, contrasting sharply with the $55 million in weekly inflows seen in January.
Reduced ETF buying removes a critical bid under XRP’s price. Without steady institutional accumulation to absorb selling pressure, the token becomes more vulnerable to retail-driven swings and broader market weakness. This lack of fresh capital directly supports the bearish case, pushing XRP lower as supply overhang grows and demand dries up.
XRP Bear Flag Breakdown is Underway
The XRP/USD pair has confirmed a classic bear flag pattern on the two-day chart, setting the stage for a massive move downward.
The pattern formed after an initial sharp decline from January highs near $2 to lows around $1.13 on Feb. 6, representing a 42% decrease in price. The subsequent consolidation created the flag: a rising channel of lower highs and higher lows that trapped buyers in a false recovery, as shown in the chart below.
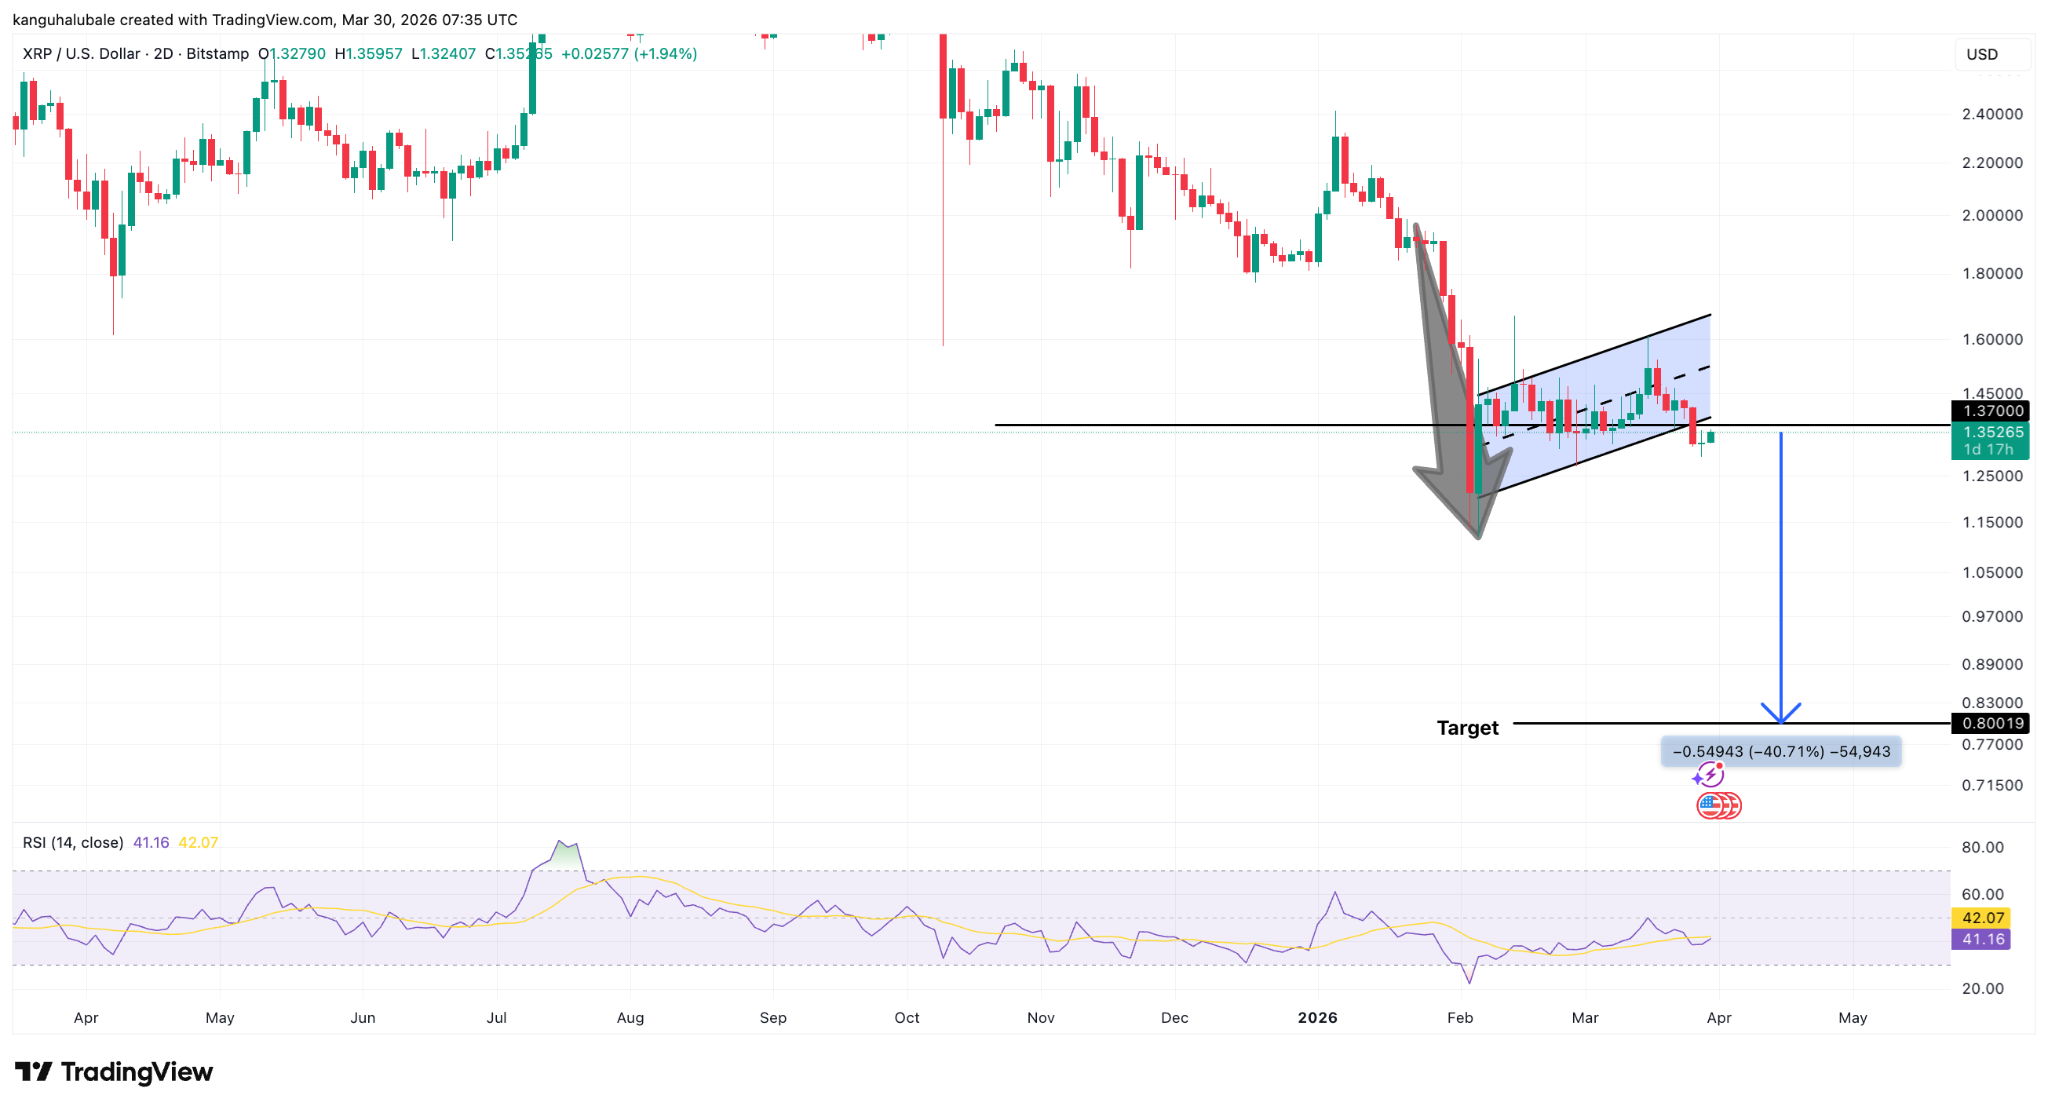
XRP/USD two-day chart. Source: TradingView
A breakdown below the flag’s lower trend line near $1.37 has now occurred on elevated volume, confirming continuation of the downtrend.
In technical analysis, the bear flag’s measured move projects a decline equal to the pole’s length from the breakdown point. Applied here, that calculation points precisely to the $0.80 zone, representing the full 40% drop from current levels.
Supporting indicators reinforce the setup. The relative strength index (RSI) shows hidden bearish divergence, and XRP remains below key moving averages on multiple timeframes.
The recent modest bounce to $1.60 was a classic bear trap, fitting the flag’s bearish resolution. A decisive close below $1.30 would accelerate the move, with $1.20 acting as intermediate support before the final leg to $0.80.
My Take
The bear flag’s confirmation on the two-day chart provides a clear, quantifiable roadmap. Combined with the macro and ETF headwinds, it leaves little room for a bullish setup in the near term. Traders should monitor $1.30–$1.35 for any final defense, as a clean breakdown would confirm the path lower.
We hope you enjoyed reading our analysis of Ripple. If you’d like to trade with one of the best crypto CFD brokers, check out our list.