
The USD/MXN exchange rate wavered on Monday as the recent downward trend took a breather. The pair was trading at 17.21 on Monday, down substantially from last year’s high of 21.30. This retreat has coincided with the broader gains in emerging market currencies.
Geopolitics and Key US Jobs Data
The USD/MXN pair was little changed on Monday as geopolitical risks accelerated during the weekend after the US and Israel attacked Iran. Iran responded by launching missile and drone attacks in Israel and other countries in the Middle East.
The immediate impact of this crisis is the ongoing surge in crude oil prices, with top benchmarks nearing the key resistance at $90. Analysts believe that prices will continue soaring in the coming weeks if the escalation continues.
Mexico may benefit from the ongoing crisis because it is one of the biggest oil producers globally. It produces over 1.6 million barrels each day. While it consumes most of this oil, it also sells it to other countries, including the US and in Latin America.
The USD/MXN pair also wavered after the recent killing of El Mencho, a to cartel boss in the country. This killing led to a surge in violence in key areas, a move that will affect the tourism industry.
Looking ahead, there will be no major economic data from Mexico other than the fixed investment report on Wednesday. The most important data will come out from the US, which will release the latest jobs data on Wednesday and Friday.
Economists expect the upcoming macro data to show that the labor market softened in February. For example, the average estimate is that the economy created 70k jobs February, much lower than the 130k it added in the previous month. There is also a possibility that the BLS will downgrade the January figure.
USD/MXN Technical Analysis
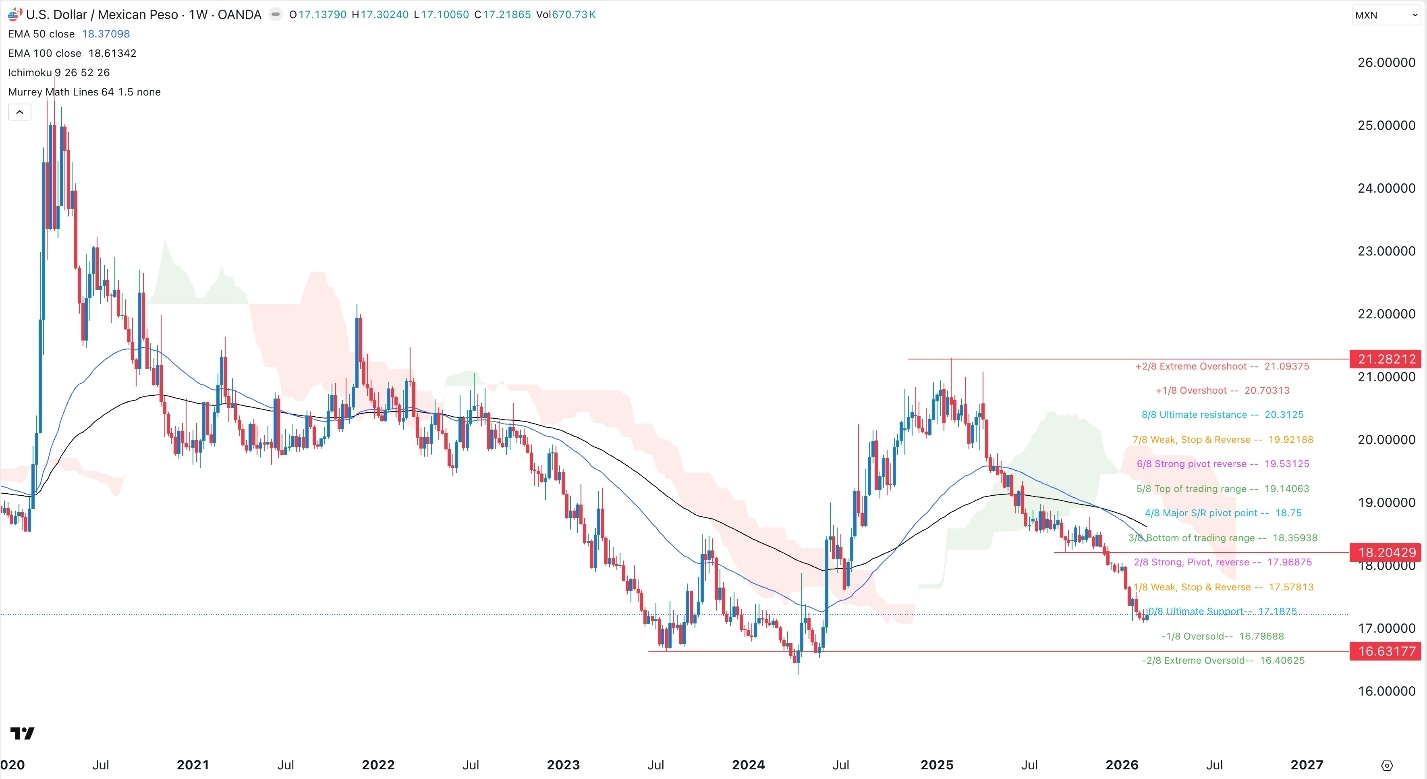
The weekly timeframe chart shows that the USD/MXN pair has been in a downward trend since last year. It has dropped from a high of 21.28 last year to the current 17.21.
The pair remains below the psychological level at 17.50. It has also dropped below all moving averages, a sign that bears are in control for now. It also moved below the Ultimate Support of the Murrey Math Lines tool at 17.18.
Therefore, the pair will likely continue falling, with the next key target being at 16.63, its lowest level in 2024.