
Bearish view
Sell the GBP/USD pair and set a take-profit at 1.3185.
Add a stop-loss at 1.3500.
Timeline: 1-2 days.
Bullish view
Buy the GBP/USD pair and set a take-profit at 1.3500.
Add a stop-loss at 1.3185.
The GBP/USD exchange rate was flat on Thursday as traders focused on new developments in the Middle East, where the war is continuing. It was trading at 1.3375, a few points above this week's low of 1.3257.
US Non-farm Payrolls Data and Middle East Crisis
The GBP/USD pair remained in a tight range as traders focused on the new developments in the Middle East, where the media reported that Iran had reached out to the United States for a deal to end the war. Still, data on prediction markets show that odds of a ceasefire happening soon are falling.
The report of Iran’s overtures to the United States helped drag the US dollar lower. The US Dollar Index (DXY) dropped to $98.80, down from this week's high of $99.68. It also led to a risk-on sentiment, with Bitcoin and the stock market rising.
The GBP/USD pair reacted to the February services and composite PMI numbers from the United States and the United Kingdom. A report showed that the UK services PMI retreated slightly from 54 to 53.9 in February, while the composite figure remained unchanged at 53.7. A PMI number of 50 and above is a sign that a sector is growing.
The US services PMI rose to 56.1, while a report by ADP showed that the private sector added over 63k jobs in February after adding 11k in January.
The next key catalyst will be the upcoming official jobs numbers, which will come out on Friday this year. Economists expect the upcoming report to show that the economy added over 70k jobs in February as the unemployment rate remained unchanged at 4.3%.
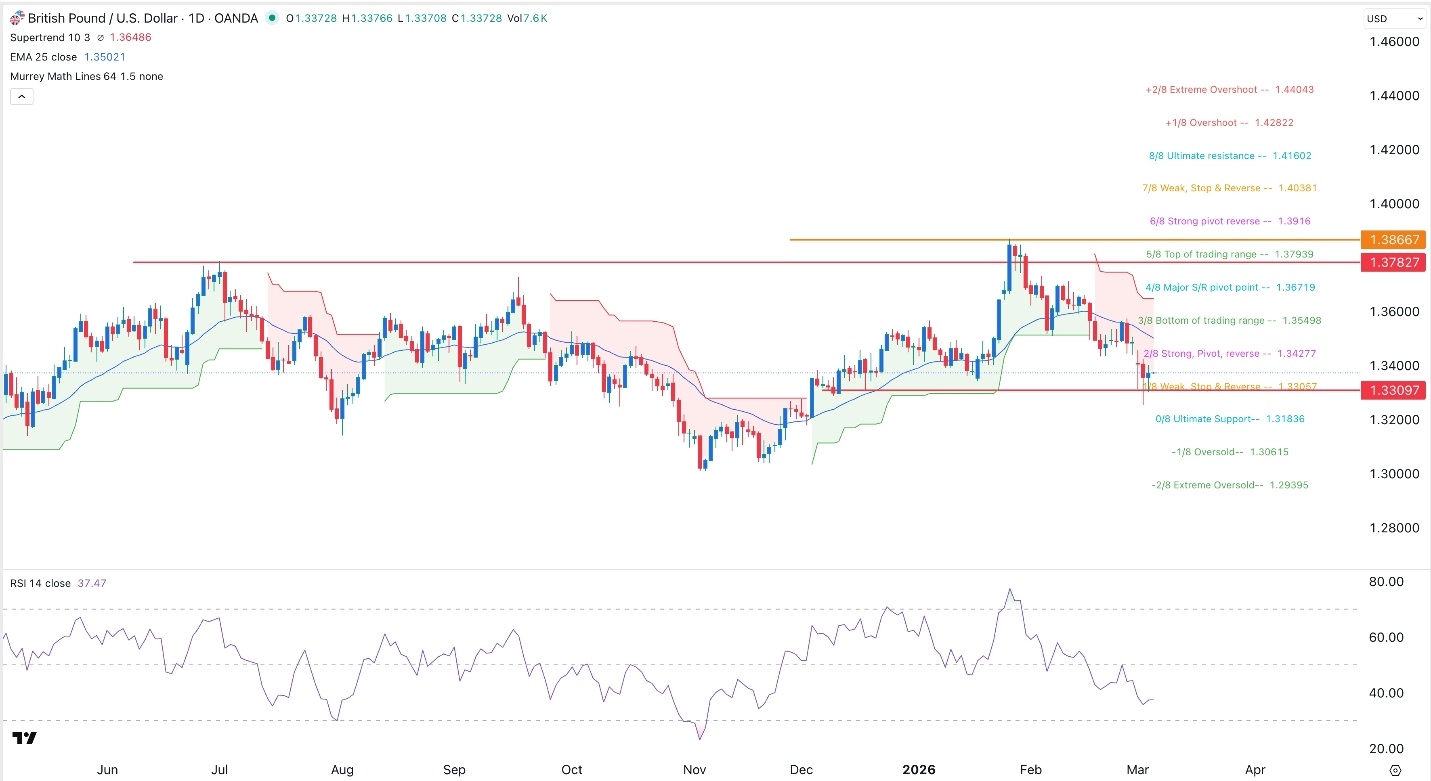
GBP/USD Technical Analysis
The GBP/USD exchange rate has come under pressure in the past few as the US dollar staged a strong comeback amid elevated risks. It retreated from a high of 1.3866 in January to a low of 1.3252 this week.
The pair has now formed a harami candlestick, a common bullish reversal signal. However, it remains below the Supertrend indicator and the 50-day Exponential Moving Average (EMA).
The Relative Strength Index (RSI) has continued its strong downward trend, moving from a high of 76 in January to the current 35. It also dropped below the Strong, Pivot and Reverse point of the Murrey Math Lines.
The pair will likely continue to remain in a narrow range ahead of the upcoming jobs data. The key support and resistance levels to watch will be at 1.3183 and 1.3500.