
Bullish view
Buy the GBP/USD pair and set a take-profit at 1.3500.
Add a stop-loss at 1.3300.
Timeline:1-2 days.
Bearish view
Sell the GBP/USD pair and set a take-profit at 1.3300.
Add a stop-loss at 1.3500.
The GBP/USD exchange rate was flat on Tuesday, a few pips above this month's low of 1.3220. It will be in the spotlight in the next few days as the UK publishes its inflation report.
UK to Publish Inflation Report
The GBP/USD pair wavered after Donald Trump changed his mind on his planned attacks on Iranian infrastructure, which he promised during the weekend.
That attack, while illegal, would have led to a more widespread war in the Middle East as Iran had promised to attack infrastructure in the region, leading to higher energy prices and volatility.
Trump's decision to pause the attack for five days pushed crude oil prices lower, raising the possibility that inflation will be moderated this year.
The next important catalyst for the GBP/USD pair will be the upcoming S&P Global’s flash manufacturing and composite PMI data from the US and the UK. Economists expect the report to show that the UK manufacturing and services PMIs fell to 50.5 and 53, respectively.
In the US, the two figures are expected to come in at 51 and 51.7, respectively. These numbers mean that the UK and US economies did fairly well this month.
The other key data will be the upcoming UK consumer inflation report, which comes out on Wednesday. Economists expect the upcoming UK inflation rose by 3% in February, while the core inflation rose 3.1%. These numbers come a week after the Bank of England (BoE) left interest rates unchanged.
GBP/USD Technical Analysis
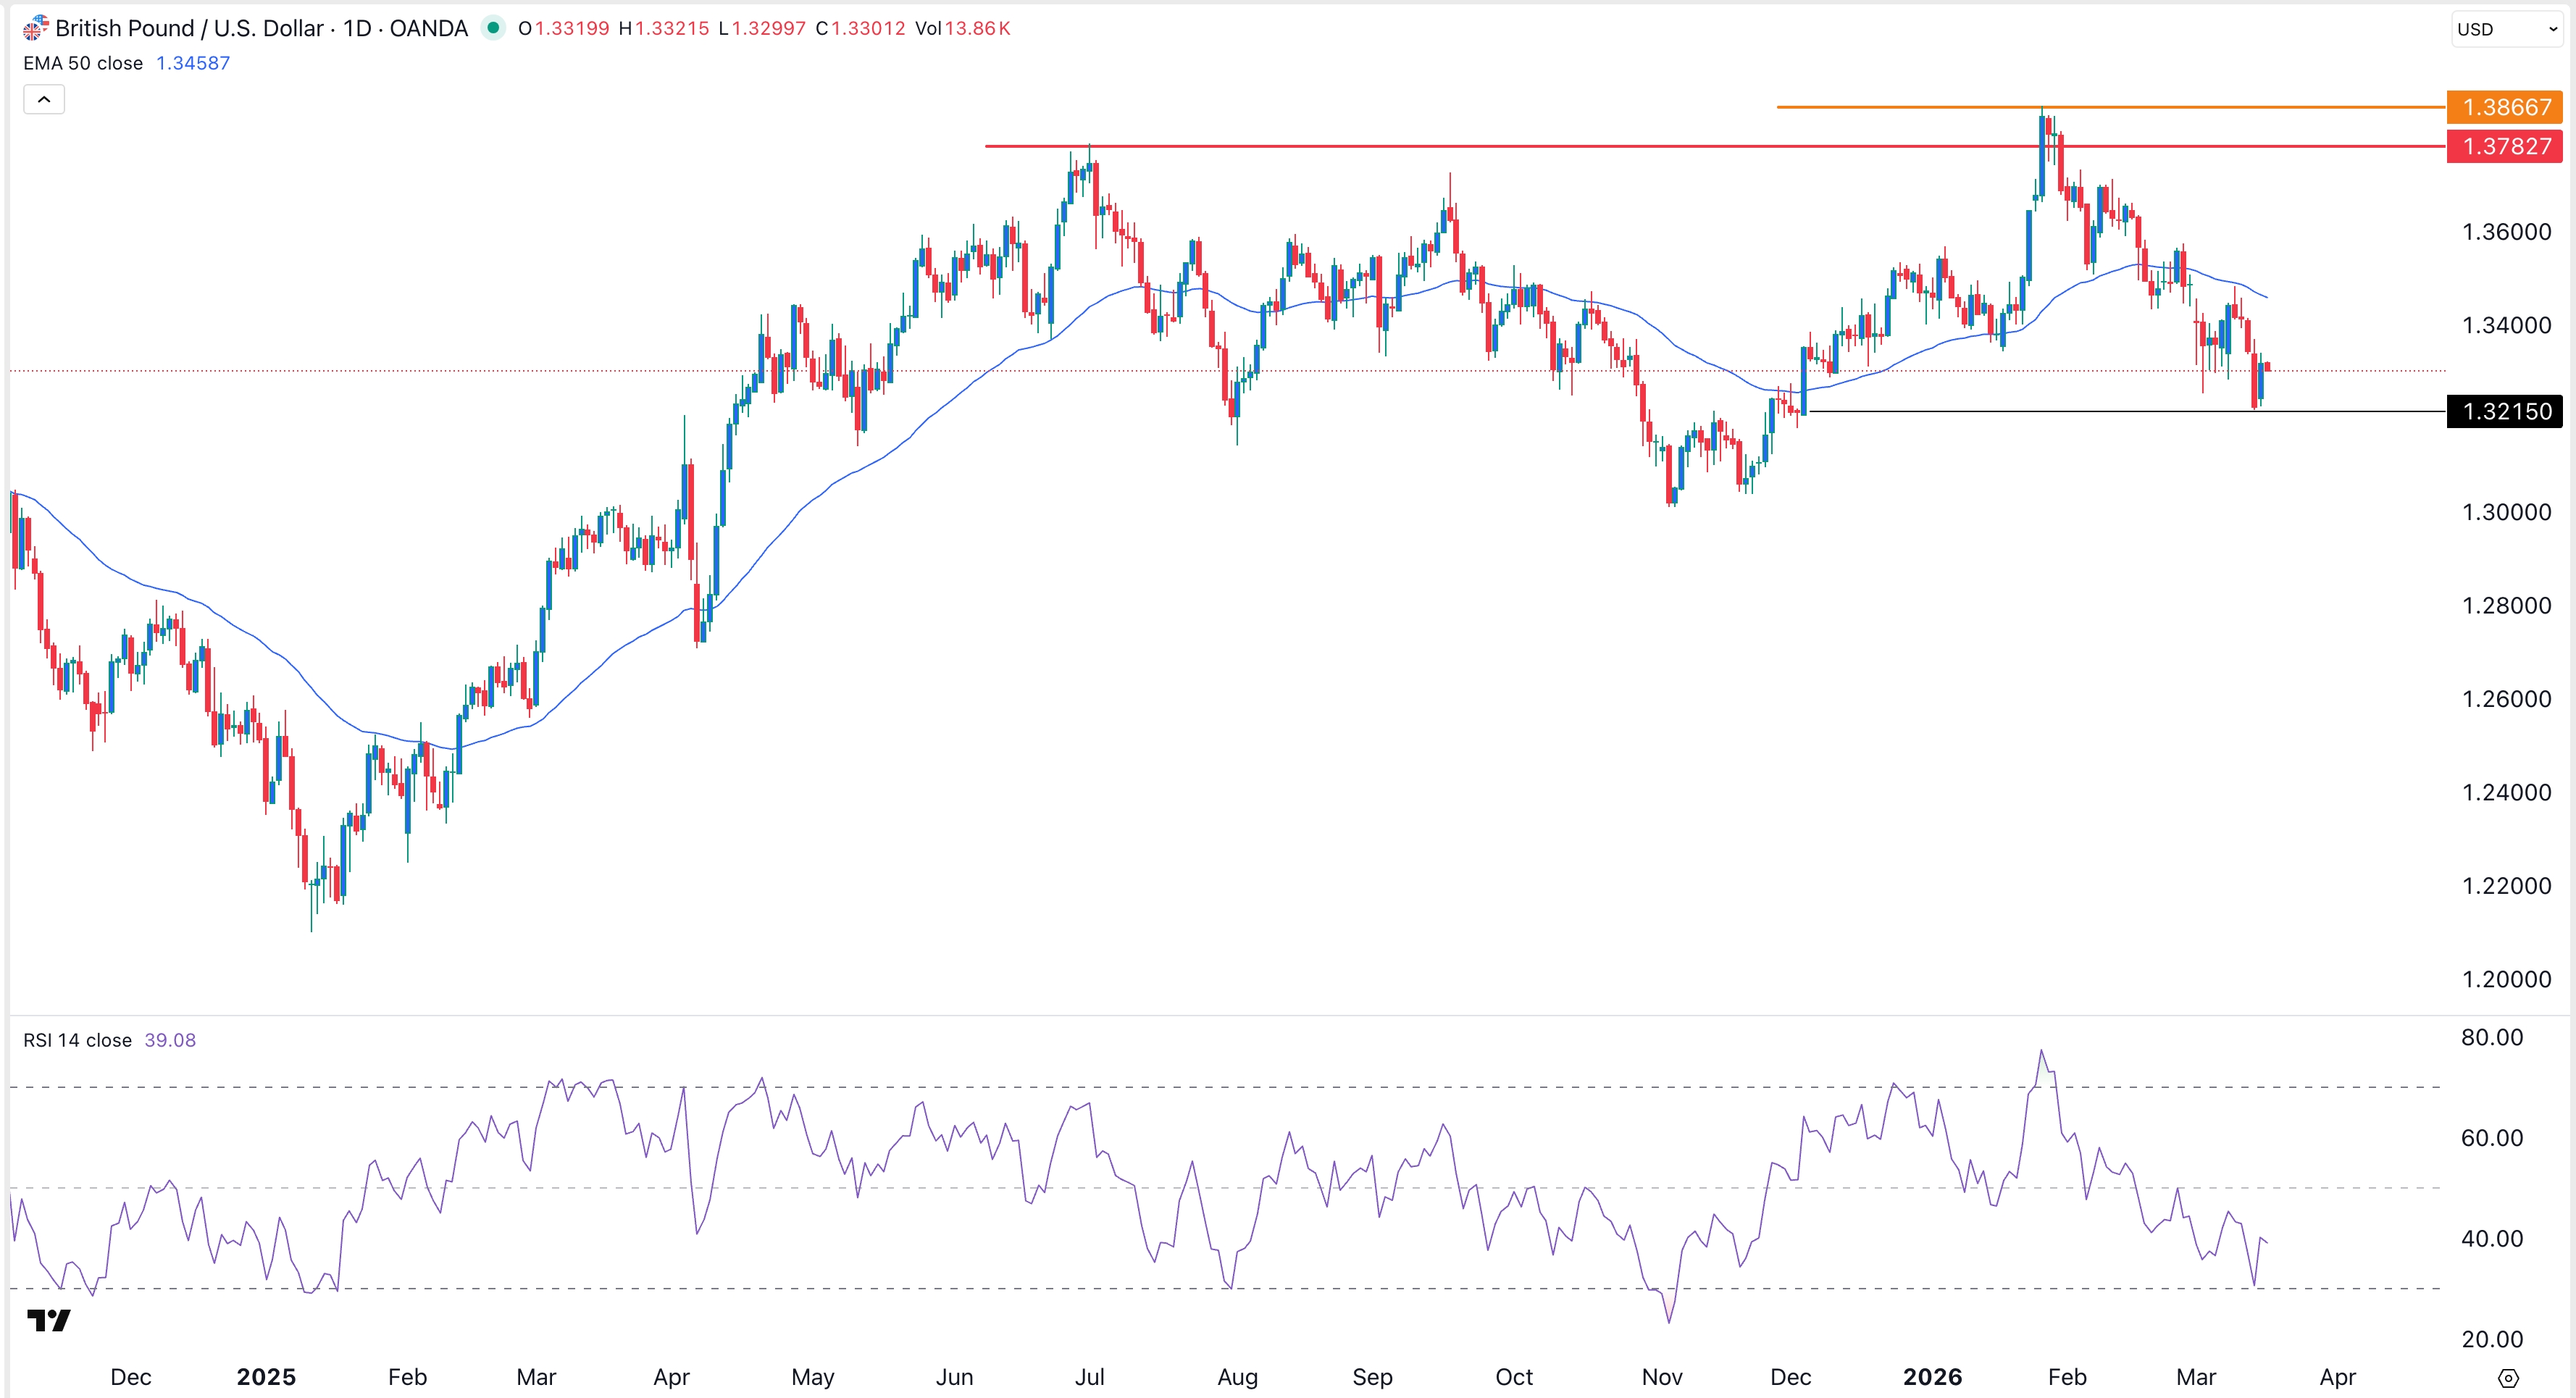
The daily timeframe chart shows that the GBP/USD pair was trading at 1.3385 on Tuesday, up from this month's low of 1.3220.
On the one hand, it remains below the Supertrend indicator and the 50-day Exponential Moving Average (EMA).
The pair has formed a large falling wedge pattern, which is made up of two descending and converging trendlines. It also formed a large inverted head-and-shoulders pattern.
Therefore, the pair will likely continue rising as traders target the next key psychological level at 1.3500. The bullish outlook will become invalid if the pair drops below the right shoulder section at 1.3220.