
With market conditions aligning to last year’s strong bullish gain pattern, many analysts believe this could set the stage for another significant upside move for Ethereum.
Ether’s Fractal Targets $6,000
Ether’s price action in the weekly timeframe mirrors a technical structure that marked the 2025 cycle low in April, preceding a sharp upside reversal. The formation came after a multi-week consolidation with a retest of an ascending trend line that has supported the price since the 2022 bear market low.
ETH/USD pair bounced off the ascending trend line in late April 2025, triggering a cascade of short liquidations and fresh buying that ultimately delivered 257% gains to its current all-time high of $4,950 reached in August 2025.
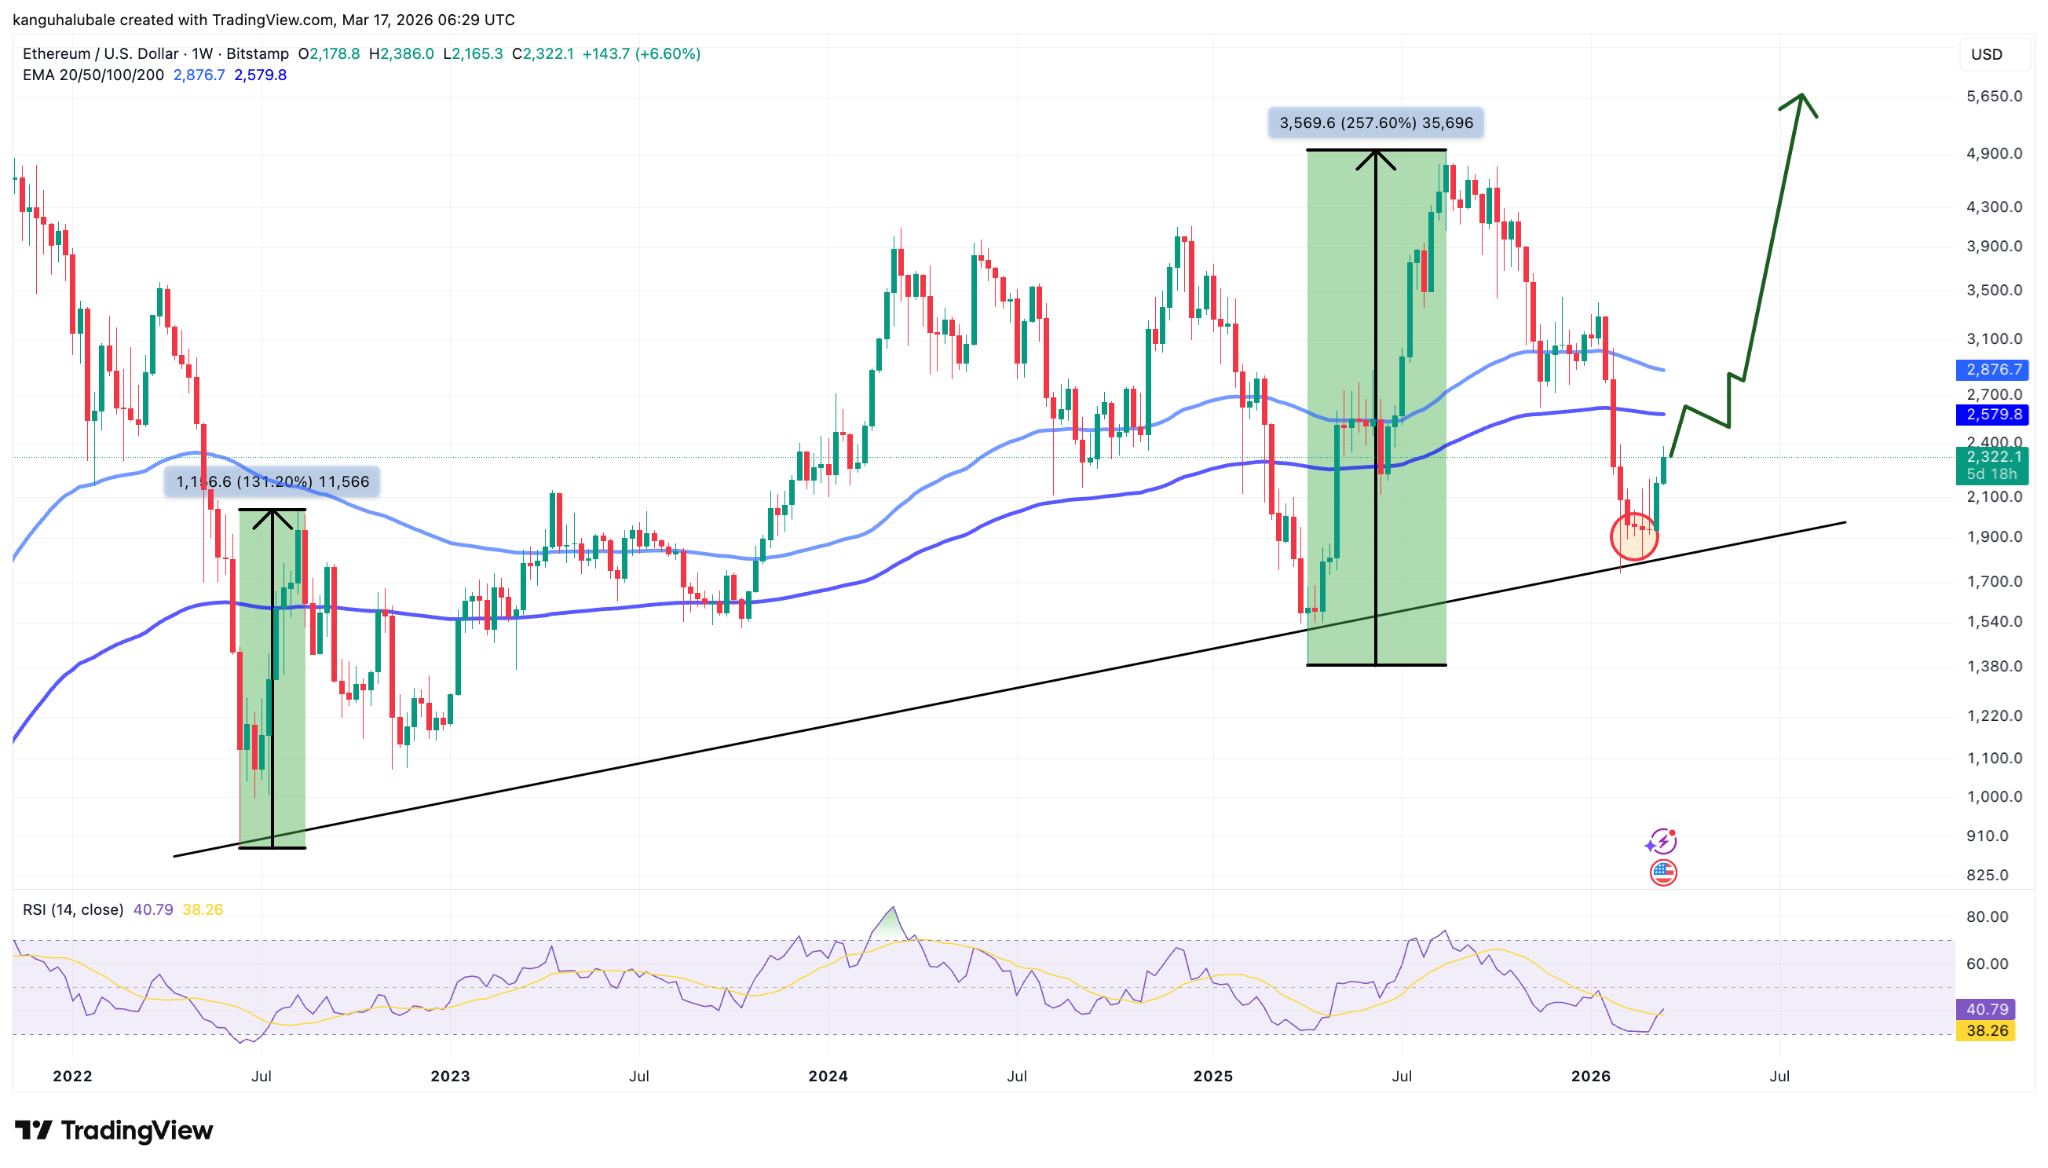
ETH/USD weekly chart. Source: TradingView
In March 2026, the altcoin is painting a similar picture, with the price again bouncing off the same structural support line seen last year.
If history repeats itself, ETH could see a sharp rise hitting new all-time highs in 2026. If it rises with the same percentage as last year, the measured move is projected toward $6,300, marking a new all-time high.
Market participants are already positioning for the breakout, as evidenced by rising open interest in weekly options expiring in the second quarter. The weekly timeframe’s reliability in capturing Ether’s major cycle turns makes this fractal particularly compelling; past cycles have shown that when the structure aligns with seasonal strength and broader risk-on sentiment, the resulting impulse wave tends to be both rapid and sustained.
On-Chain Indicators Highlight ETH at Historical Bottom Zone
Ether’s on-chain indicators reinforce the technical setup by placing current valuations at levels that have repeatedly marked major price bottoms.
The MVRV Extreme Deviation Pricing Bands show ETH retesting its realized price after bouncing off near the lower end of its historical valuation range, as shown in the chart below.
This narrow corridor has historically served as a reliable accumulation zone. Every time Ether broke above the realized price in the past has historically been followed by massive rallies, as seen in 2025.
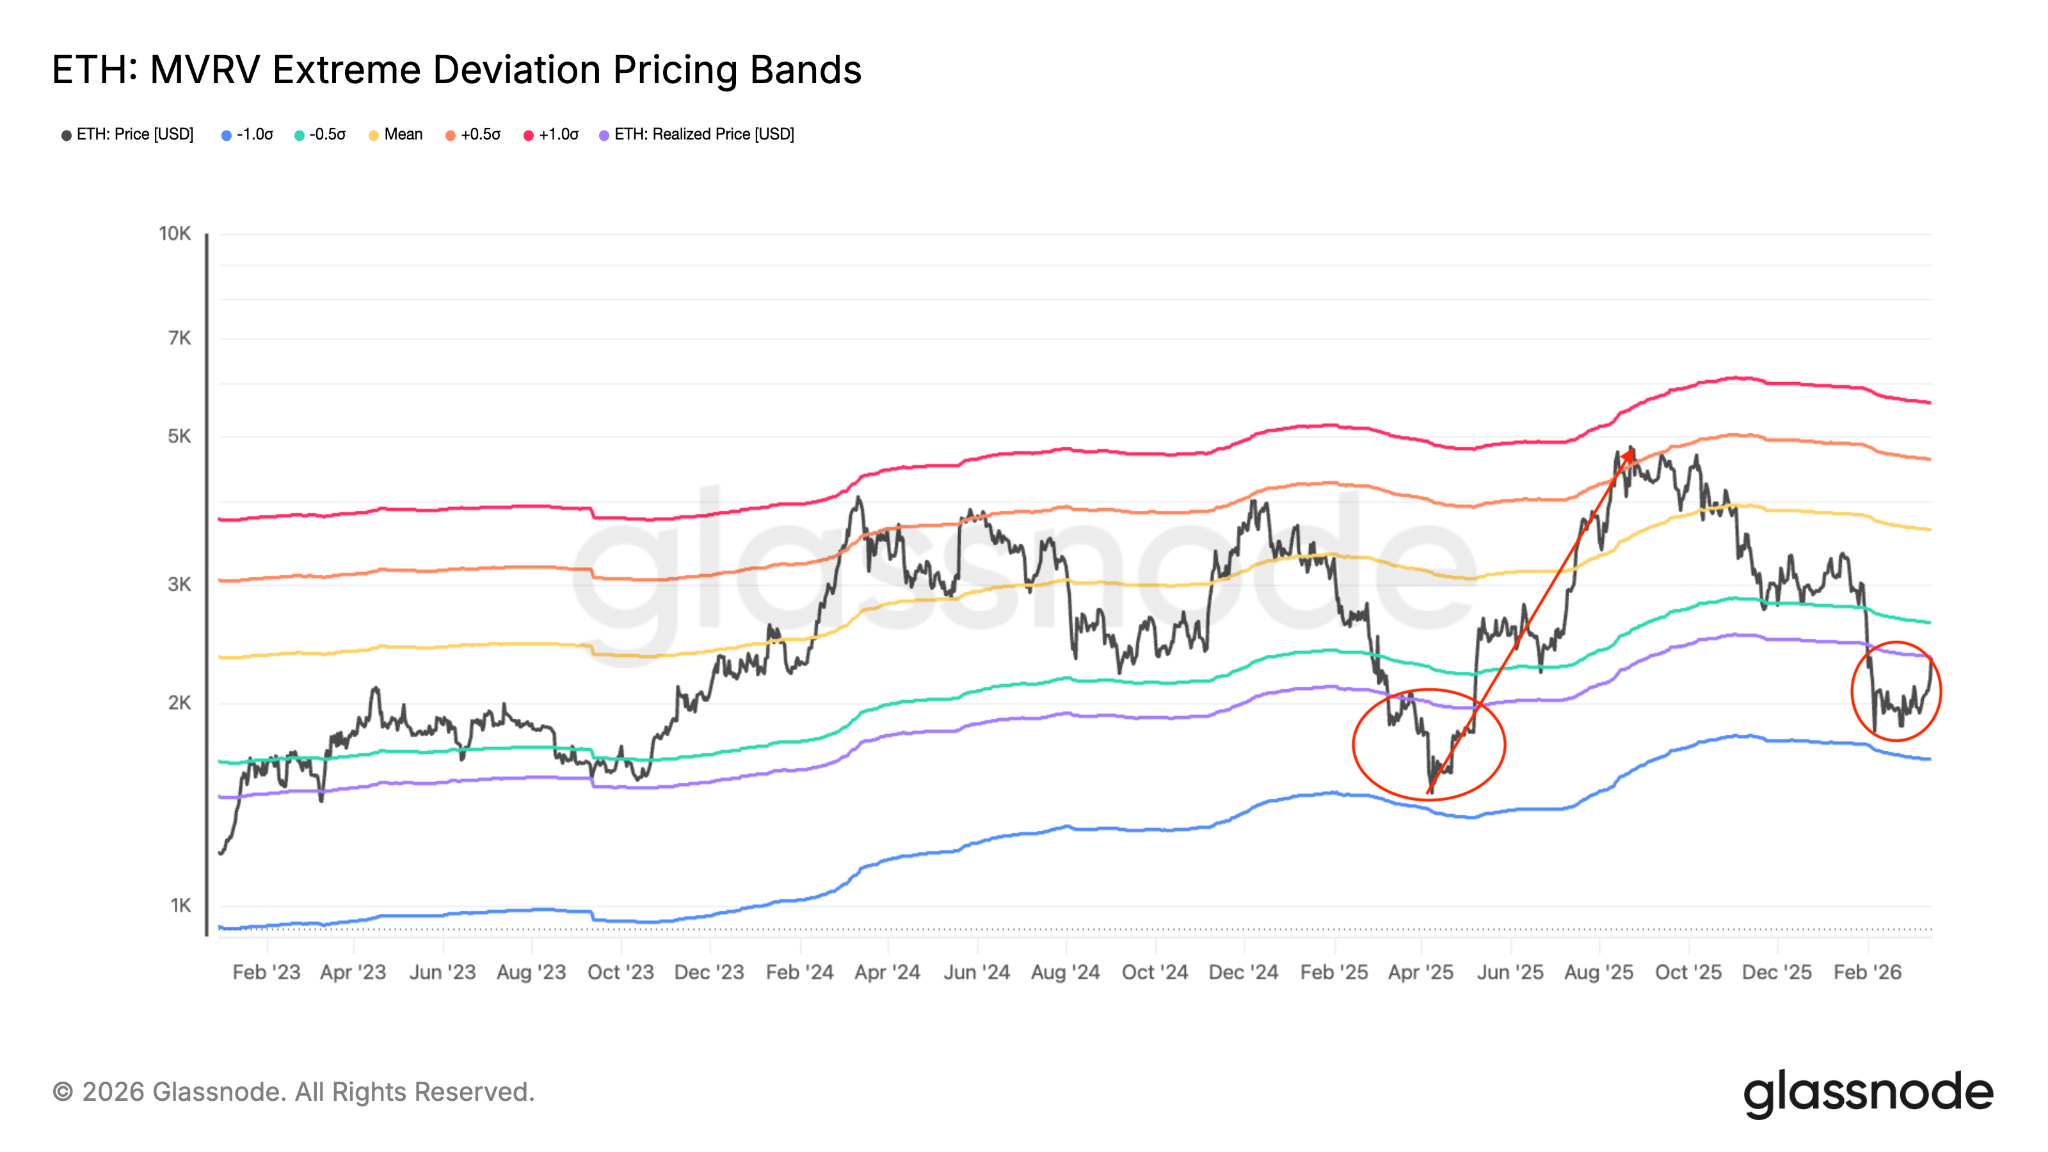
ETH: MVRV extreme deviation pricing bands. Source: Glassnode
Complementing the MVRV bands is the cost-basis distribution heatmap, which displays a dense cluster around $2,800. This concentration represents the price level at which investors acquired more than 6.1 million ETH in the past three months.
Such thick clusters act as powerful magnetic resistance because investors who bought at that level are statistically likely to sell on modest rallies, creating a roof that sellers can defend. Once price clears the upper edge of the cluster, the path upward often accelerates as overhead supply thins dramatically.
Analysts note that the distance between the current spot price and the top of this $2,800 band is unusually compressed, suggesting any decisive breakout could generate significant momentum.
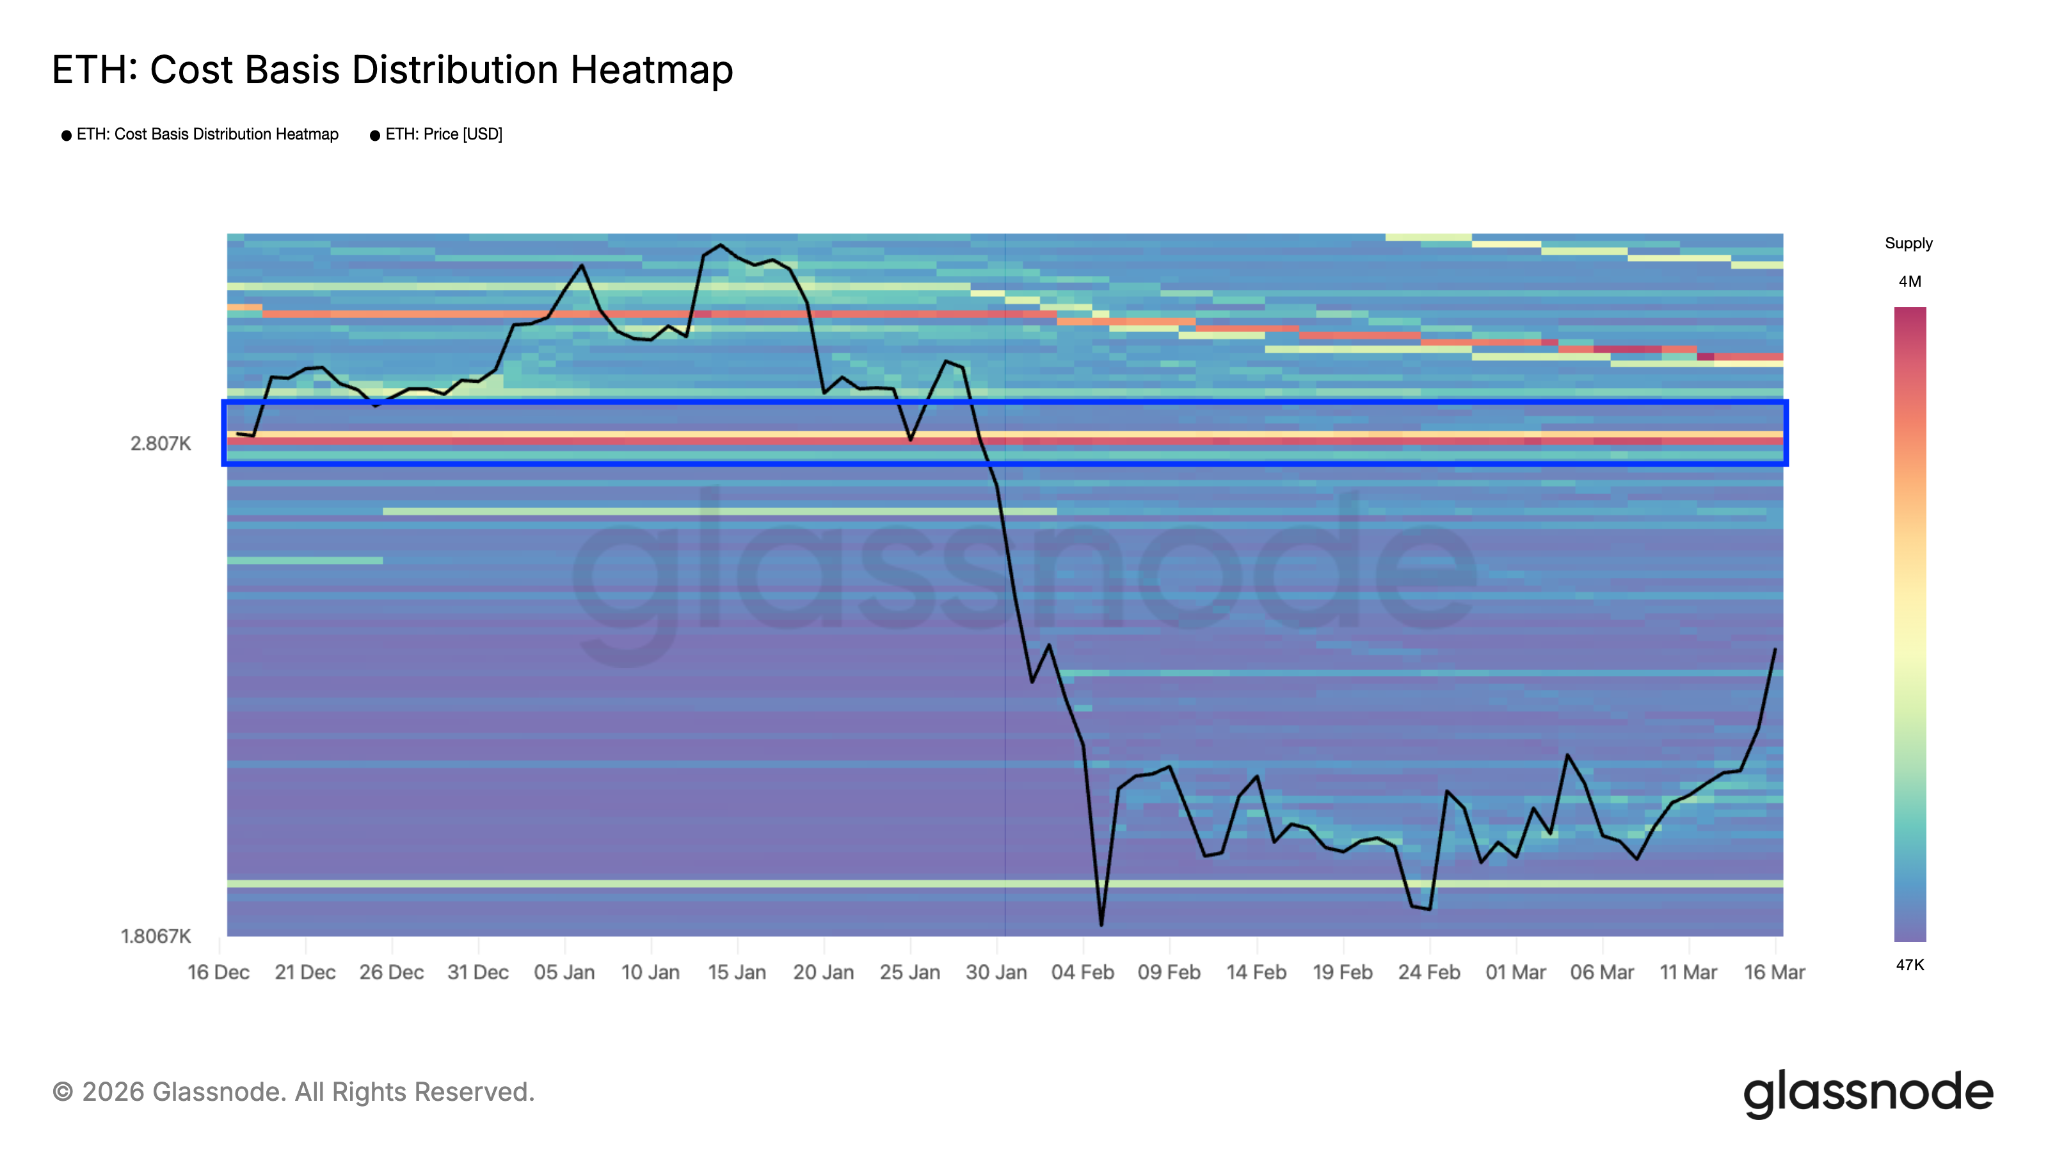
ETH: Cost Basis Distribution Heatmap
Together, these on-chain metrics paint Ethereum as fundamentally undervalued relative to its network utility and historical pricing behavior. The combination of MVRV positioning at multi-year lows and a concentrated cost-basis support zone mirrors the exact conditions present before the 2025 rally, providing quantitative confirmation that the technical fractal is underpinned by solid investor positioning rather than mere chart art.
Surging Network Activity and Staking Fuel Bullish Outlook for Ether
Ethereum’s high network activity backs Ether’s upside even as the price has declined by 30% year-to-date in 2026. According to CryptoQuant data highlighted by analyst CW8900, on-chain transaction volume and active address counts have risen steadily while spot prices retreated. This classic divergence — falling price alongside rising usage — is widely interpreted as strong accumulation activity by long-term holders who view the dip as a buying opportunity rather than a fundamental flaw.
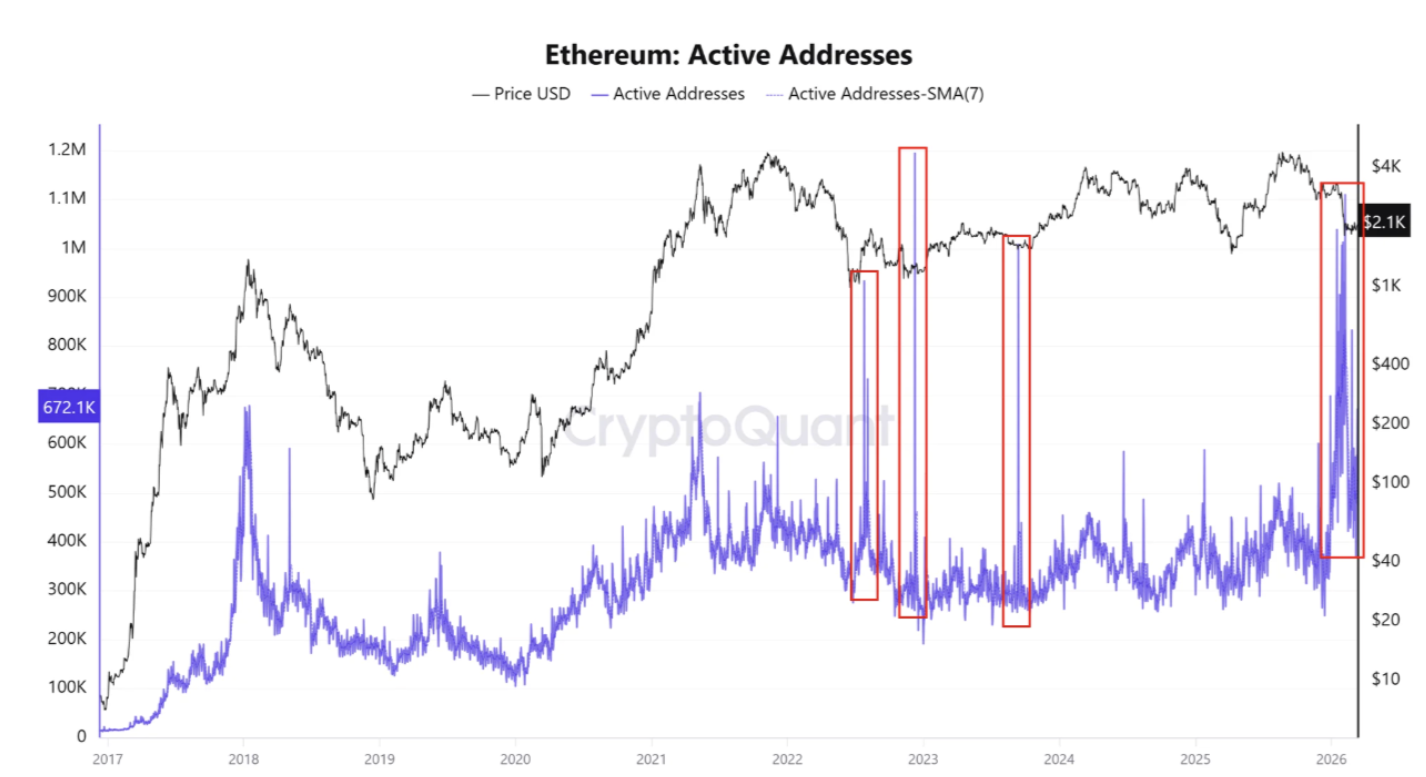
Ethereum daily active addresses. Source: CryptoQuant
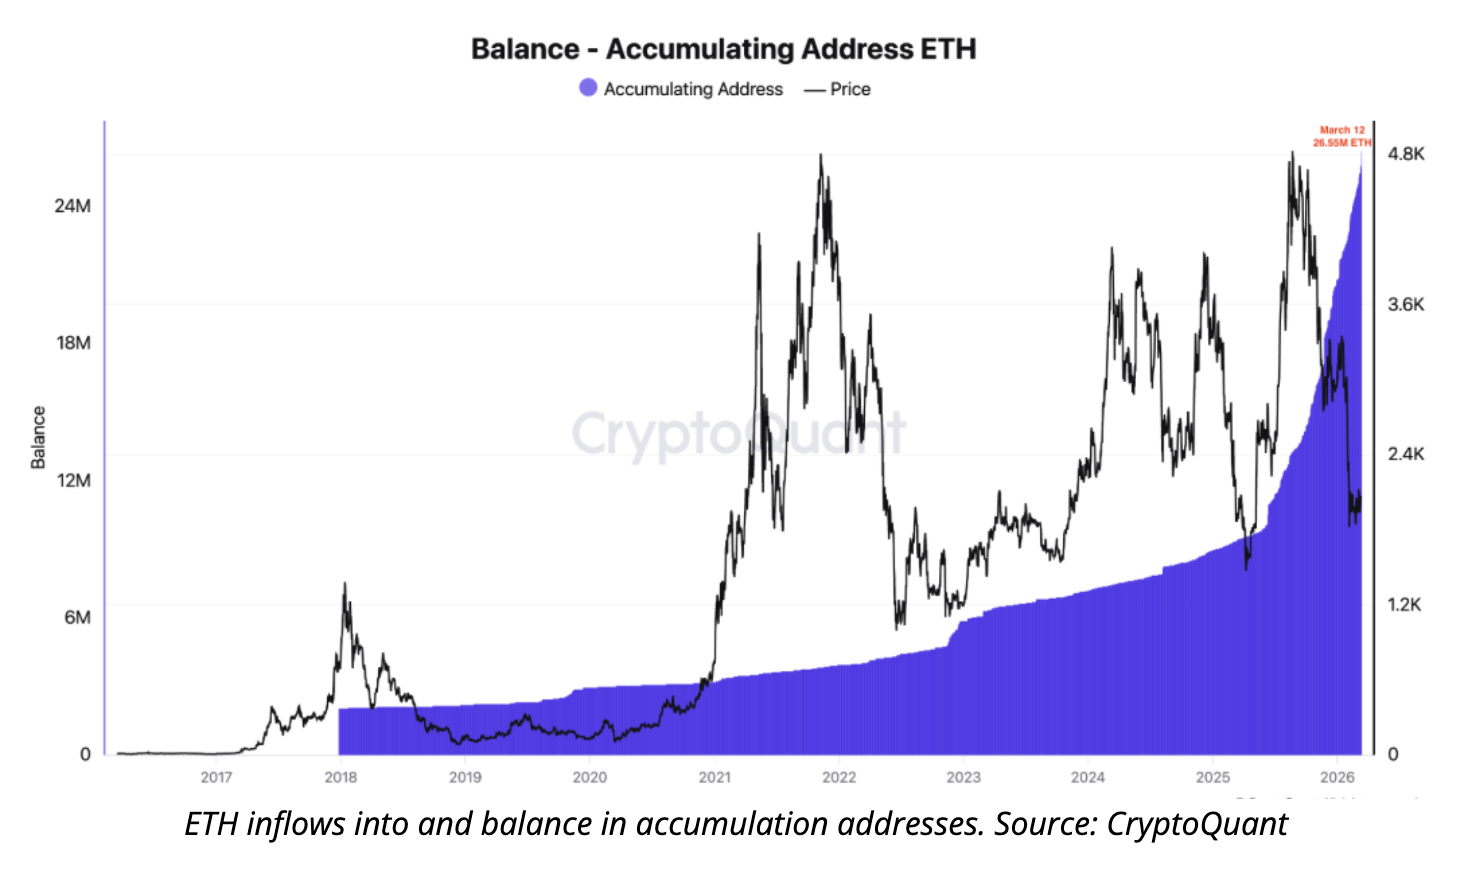
Further evidence appears in wallet flow metrics. Data shows increased inflows into accumulation addresses, leading to a 30% increase in Ethereum held in accumulation wallets since the start of 2026. These addresses, defined by low spending history and consistent inflows, have absorbed millions of ETH without distributing back to exchanges. The result is a tightening supply dynamic that reduces available sell pressure and sets the stage for scarcity-driven price appreciation once demand returns.
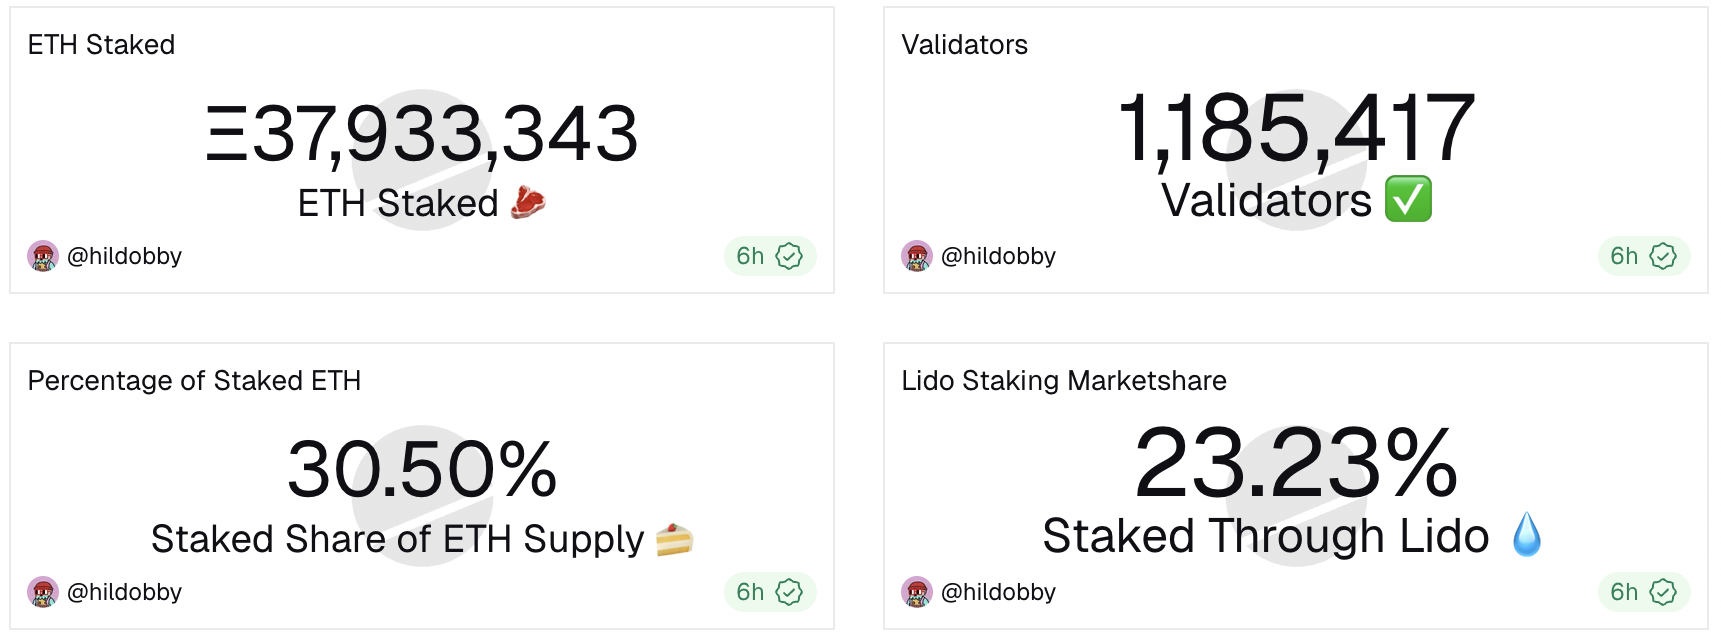
Staking metrics add another layer of bullish pressure. Total value staked has now hit 37.9 million ETH, a record high.
Each additional staked coin is effectively removed from liquid circulation for the foreseeable future, creating what many describe as a potential supply shock.
With roughly 30.5% of the total supply now locked in validators, any surge in network demand must be met by progressively smaller floating inventories. This dynamic has historically preceded sharp rallies, as seen in late 2024 and early 2025 when staking milestones coincided with price breakouts.
Staked ETH supply. Source: Dune
Exchange balances continue to drop in parallel, confirming that investors are moving ETH into self-custody or staking contracts rather than keeping coins on platforms prone to sudden selloffs.
The combination of elevated network usage, record staking participation, and shrinking exchange reserves forms a robust fundamental backdrop that aligns perfectly with the weekly fractal and on-chain valuation signals.
Should the technical breakout materialize, these on-chain tailwinds stand ready to amplify the move far beyond what technicals alone would suggest.
Ready to trade our analysis of Ethereum? Here’s our list of the best MT4 crypto brokers worth reviewing.