
After several weeks of sideways movement between $0.087 and $0.095, Dogecoin has started to press higher, approaching the $0.10 level that has repeatedly acted as resistance over the past few months.
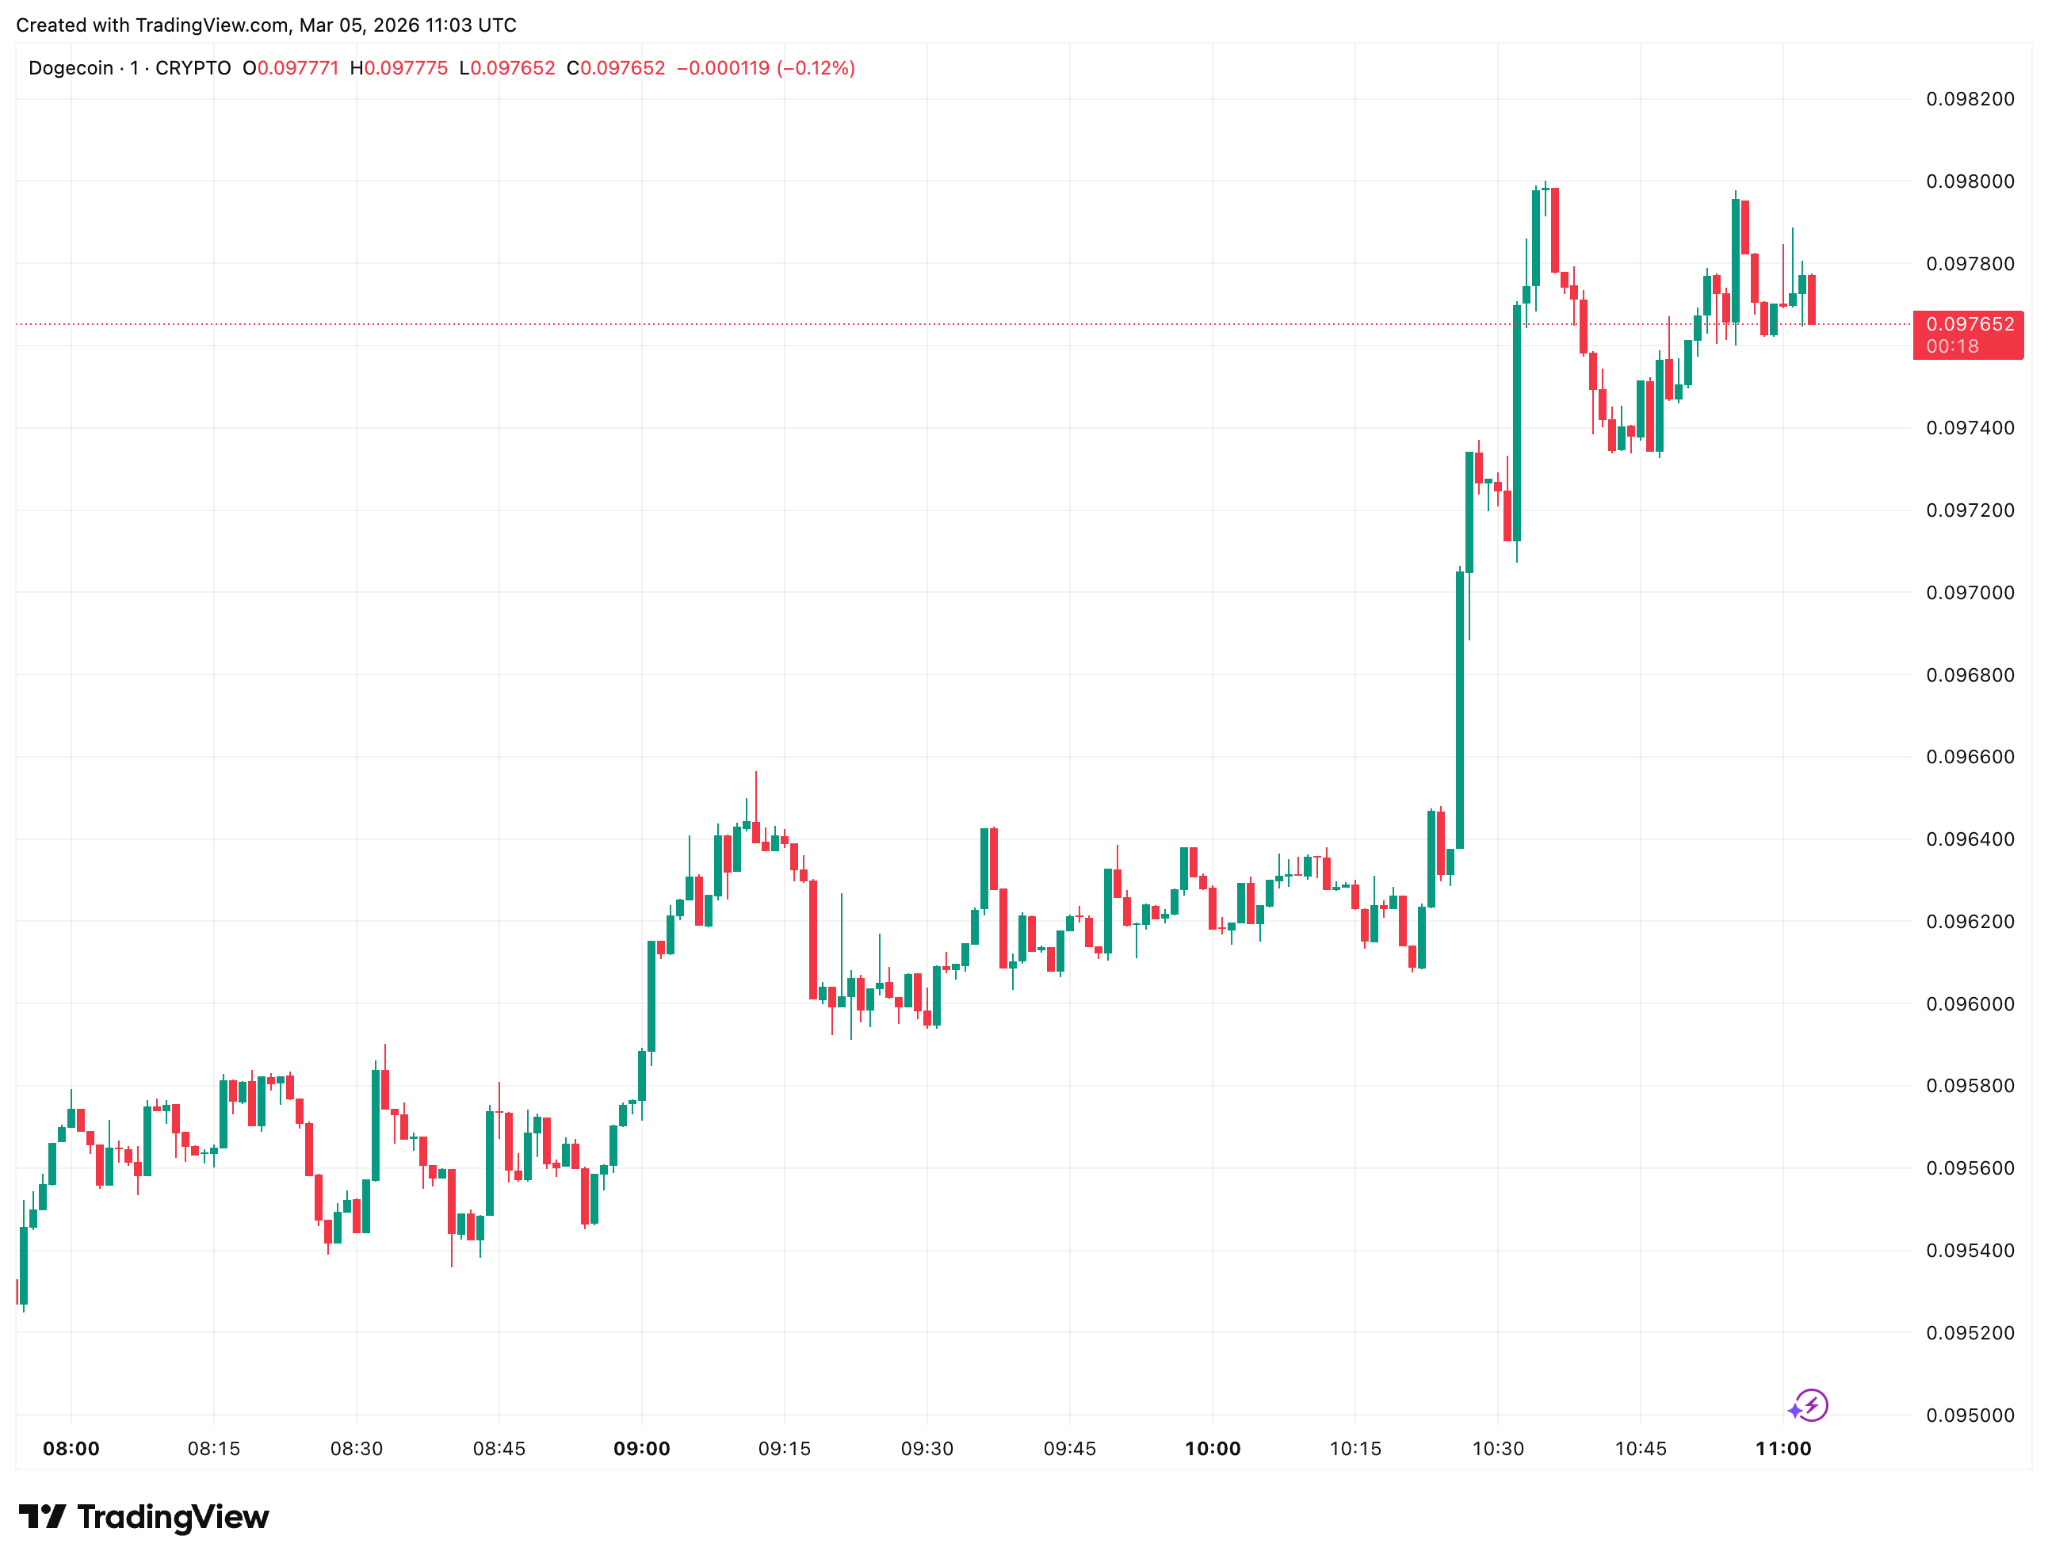
Dogecoin Price Chart | Source: TradingView
The token is currently trading near $0.096–$0.10, posting modest gains while maintaining steady upward pressure. Intraday trading has ranged from $0.091 to $0.099, reflecting improving demand as buyers step in around the lower support zone.
Trading volume has also picked up noticeably compared to the previous week. Rising volume during an approach to resistance often indicates that traders are positioning for a potential breakout attempt.
If DOGE can establish a clean move above $0.10 with sustained volume, the next technical zones quickly come into focus.
Dogecoin Momentum Strengthens Near Moving Averages
From a trend perspective, Dogecoin is beginning to stabilize around its medium-term indicators. The 50-day Simple Moving Average (SMA) currently sits near $0.094, while the 200-day SMA remains slightly lower around $0.090. The price hovering above both levels suggests that the market has regained a degree of short-term bullish momentum.
In practical terms, staying above the $0.094–$0.090 region keeps the recent upward structure intact. A sustained hold above these levels would reinforce the idea that DOGE is shifting from consolidation toward a recovery phase.
Breakout Targets if $0.10 Clears
Should Dogecoin manage a breakout above $0.10, several technical targets emerge based on previous trading ranges. The first area to watch lies around $0.11–$0.115, where earlier price reactions created a minor resistance cluster. This zone could act as the first test of bullish conviction following a breakout.
Beyond that, the $0.12 level becomes the next meaningful objective. It represents both a psychological milestone and a region where previous rallies stalled earlier in the year.
If broader market conditions remain supportive, a stronger extension toward the $0.14–$0.15 range could come into view. This region aligns with historical liquidity pockets where traders previously took profits.
While much higher targets occasionally circulate within the DOGE community, sustained moves toward those levels would likely require a larger market-wide rally rather than isolated momentum.
Key Dogecoin Support Levels to Watch
Despite the improving structure, DOGE still faces several downside risks. The $0.094–$0.095 area now serves as the first line of support, closely aligned with the 50-day moving average. Losing this level could weaken the immediate bullish structure. Below that, the $0.090 region represents stronger structural support tied to the 200-day moving average and previous accumulation zones.
A break below $0.087 would shift the market back into a defensive posture and reopen the possibility of a deeper retracement toward the $0.08 range. Such a move would suggest the recent rally was largely speculative rather than the start of a broader trend reversal.
Final Thoughts
For now, Dogecoin is approaching a critical technical moment. Holding above the $0.094 support zone keeps the short-term bullish structure intact, while a decisive move above $0.10 could open the door for a push toward $0.11 or higher.
However, failure to clear resistance may send the token back into the consolidation range that has defined its trading behavior in recent weeks.
Ready to trade our analysis of Dogecoin? Here’s our list of the best MT4 crypto brokers worth checking out.