
Chainlink’s recent price action leaves the market in an uncertain spot, with traders trying to determine if this is a temporary pause or a continuation of the broader downtrend.
Intraday Rejection Near $9.80 h2
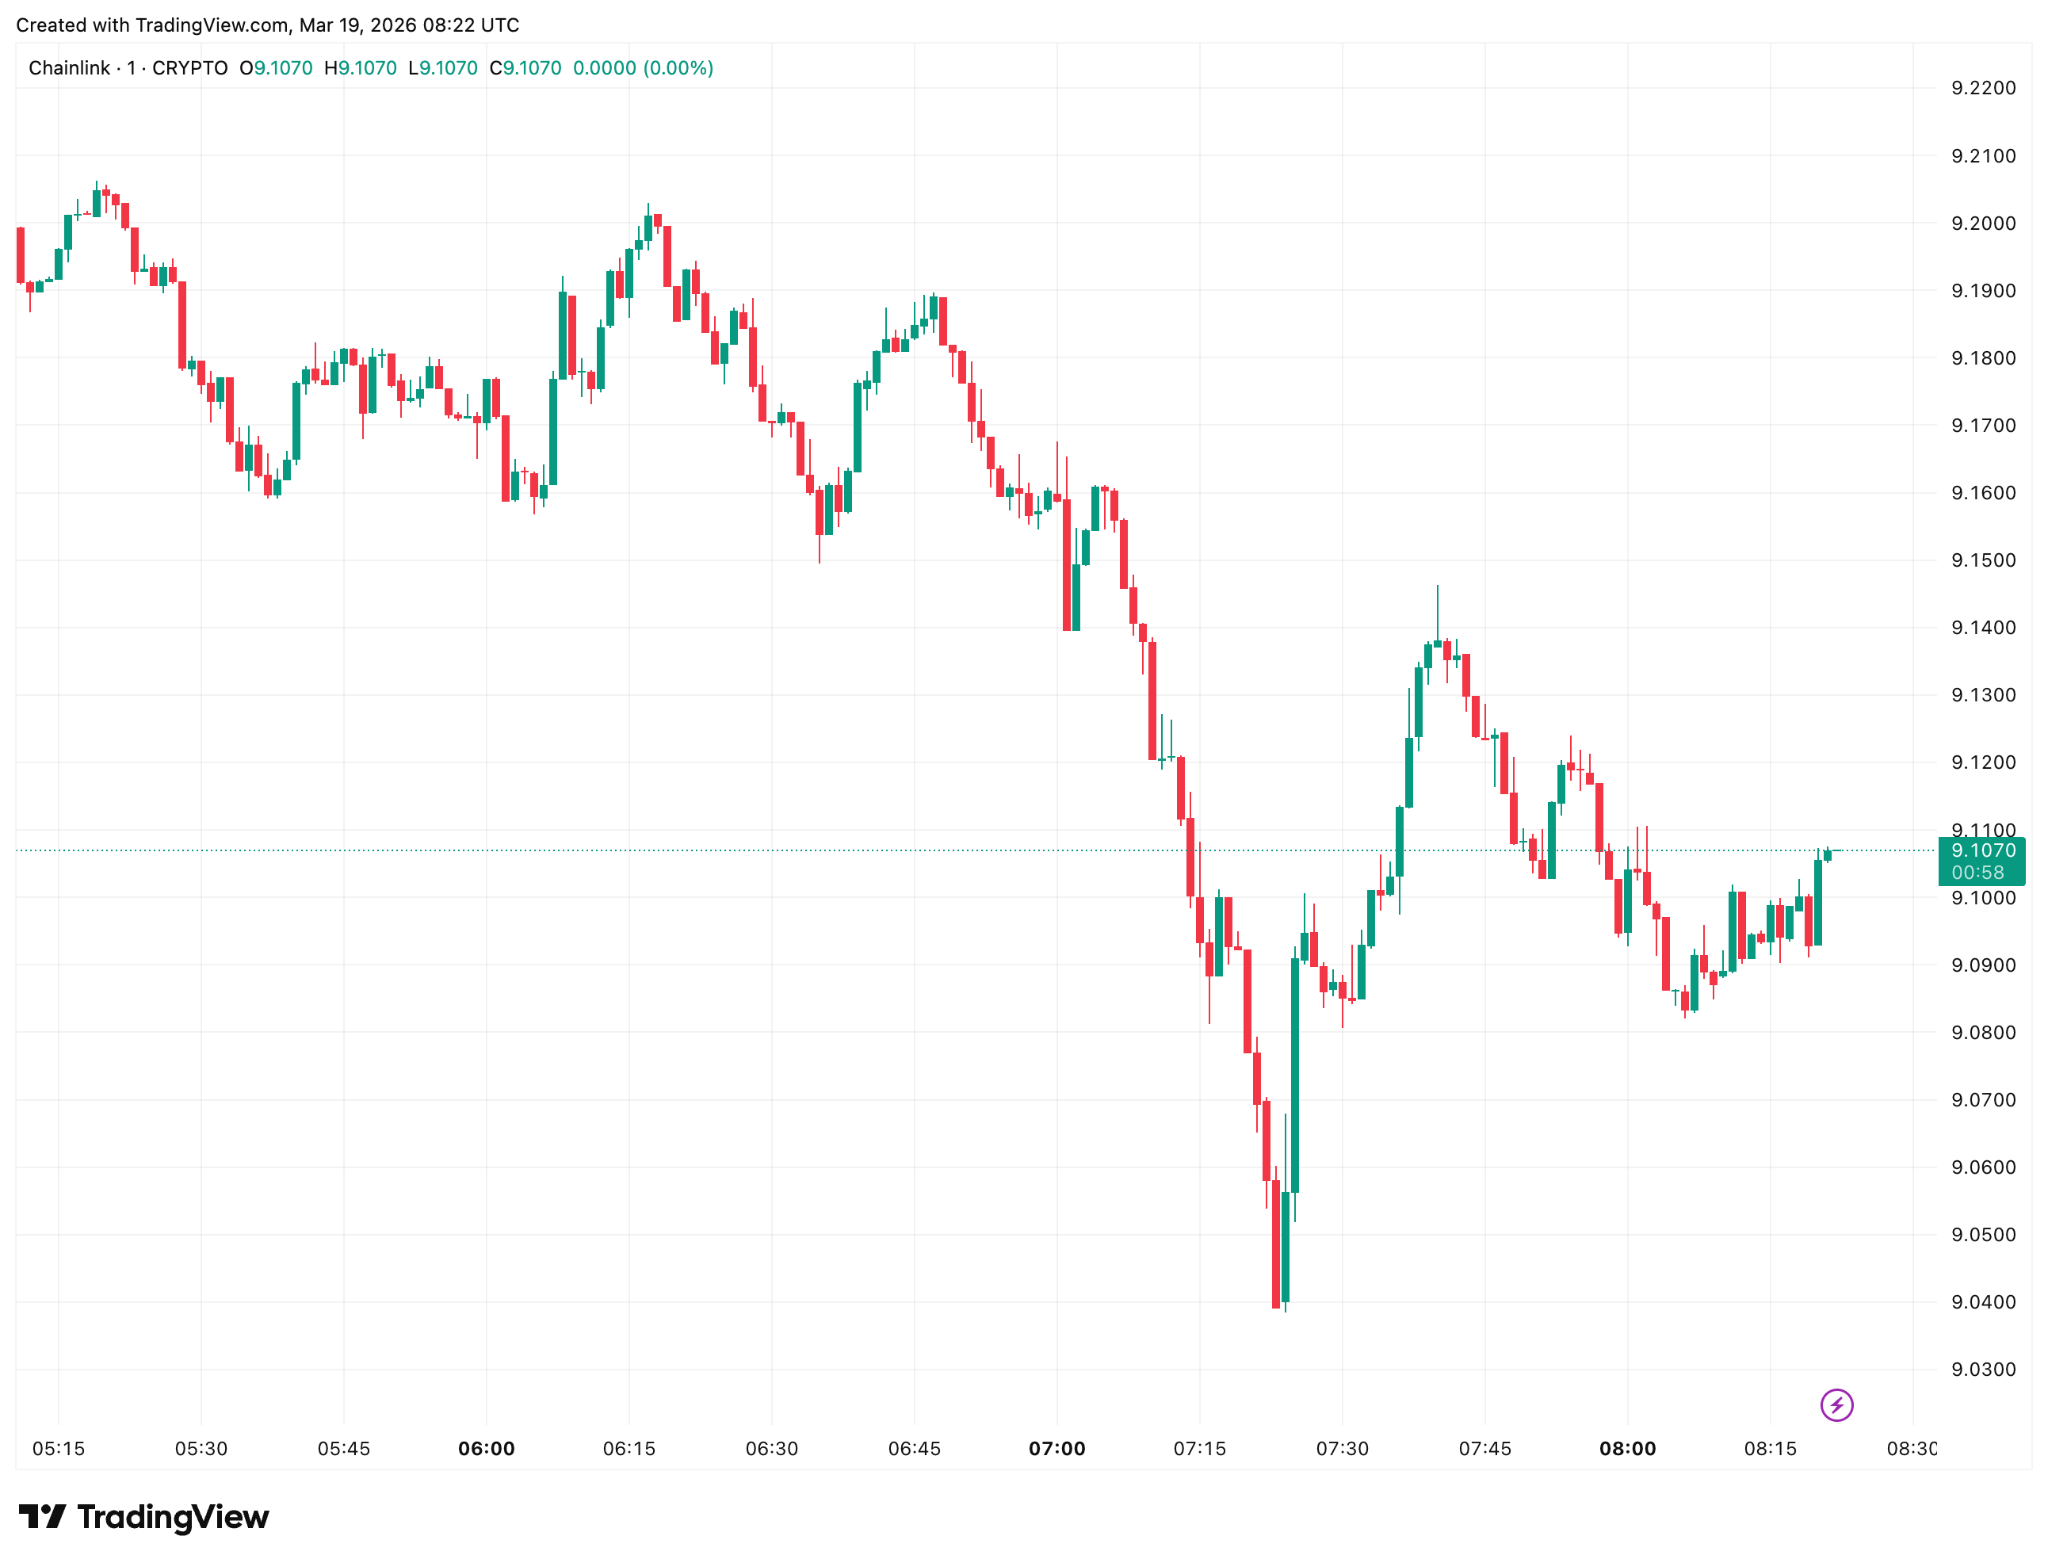
Chainlink price chart | Source: TradingView
LINK moved sharply within the day, printing a range between $9.07 and $9.86, but the move lacked continuation. After approaching the upper end of that range, the price quickly lost strength and rotated back toward support.
This kind of rejection typically reflects a lack of conviction among higher-level buyers. Traders who enter late into the move often exit quickly once momentum fades, while sellers use the strength to re-enter positions. The result is a failed push higher, rather than a sustained breakout attempt.
The $9.50–$9.80 zone is now clearly defined as an area where supply is sitting. Until that level is reclaimed with strength, upside attempts are likely to remain capped.
Lower High Structure Keeps LINK in a Bearish Trend
Zooming out, LINK continues to print lower highs without establishing a clear higher low, which keeps the broader trend tilted to the downside.
Each rally over the past sessions has struggled to break prior swing highs, reinforcing the idea that sellers remain in control of the overall structure. This is not a market that has transitioned into accumulation yet. Instead, it still behaves like a market in distribution or continuation of a downtrend.
The $10 level remains the key structural pivot. A clean move above it, followed by consolidation, would be the first meaningful signal that the trend is starting to shift.
Key Moving Averages Suggest Rallies Are Being Sold
Price is still trading below key moving averages on higher timeframes, which continues to weigh on momentum.
When an asset trades beneath these levels, rallies tend to run into consistent selling pressure. Traders often treat these zones as opportunities to exit positions or open new shorts, especially when there is no strong catalyst driving demand.
For LINK, reclaiming these averages is not just a technical milestone. It would signal a change in market behavior, where dips begin to get bought instead of sold into strength.
Momentum Remains Subdued
Momentum indicators are not showing signs of strong accumulation. The Relative Strength Index is sitting in a neutral-to-weak range, which reflects a market that lacks sustained buying pressure.
The recent volatility has been driven more by short-term positioning than by any structural shift in demand. Moves higher are not being followed by continuation, which keeps momentum suppressed and reinforces the current sideways-to-bearish environment.
For sentiment to improve meaningfully, momentum needs to expand alongside price, not fade after each push.
Key Levels to Watch
On the downside, the $9.00 level is acting as immediate support, but it has already been tested multiple times. Repeated tests of a support level tend to weaken it, increasing the probability of a breakdown if buyers fail to step in decisively.
If $9.00 gives way, the next downside targets come into focus around $8.50 and $8.00, where previous demand zones may provide temporary relief.
On the upside, the $9.50–$9.80 range continues to act as a ceiling. A breakout above this zone would likely trigger short-term momentum toward $10–$10.50, but that move would need strong volume to sustain.
My Take
LINK is currently in a fragile position. The market has not confirmed a reversal, and the structure still leans bearish. Short-term bounces are possible, but without a reclaim of key resistance levels, they are likely to be sold into.
A decisive move above $10 would begin to shift the narrative. Until then, LINK remains in a range-to-downtrend environment, where patience and level-based trading are key.
Ready to trade our analysis of Chainlink? Here’s our list of the best MT4 crypto brokers worth checking out.