
Bullish view
Buy the BTC/USD pair and set a take-profit at 75,000.
Add a stop-loss at 65,000.
Timeline: 1-2 days.
Bearish view
Sell the BTC/USD pair and set a take-profit at 65,000.
Add a stop-loss at 75,000.
Bitcoin price remained above the important resistance level at $70,000 on Wednesday morning as energy prices dipped after a key statement from Donald Trump. The BTC/USD pair was trading at 70,700, up from this week's low of 67,540.
Bitcoin Price Rises as Crude Oil Prices Drop
The BTC/USD pair rose after Donald Trump continued hinting that the United States and Iran were talking about steps to end the ongoing war. In a statement, he said that Iran had offered a present to show good faith in talks.
His statement led to a drop in crude oil prices, with Brent, the global benchmark, falling to $95 from this week's high of $100. The West Texas Intermediate (WTI) dropped to $88.
Still, Iran’s officials have maintained that they were not interested in talks because they believe that their strategy was winning. The Strait of Hormuz is still closed, while Chevron has warned that California risked an energy crisis.
California imports about 20% of its refined fuels from Asia, which are at risk of slowing because of the Hormuz crisis. The state is disconnected from key US refineries from Texas and Louisiana.
Bitcoin has also done well because of the ongoing rotation from gold to Bitcoin. Gold price has officially moved into a bear market after falling by 20% from its highest point this year. Also, spot Bitcoin ETFs have continued to add assets this month, while gold funds have shed assets in the last three weeks.
A key challenge for Bitcoin and other cryptocurrencies is that the CLARITY Act could be at risk of failure after details of the latest proposals emerged. The new details show that crypto exchanges will be barred from offering stablecoin yields in a major victory for banks.
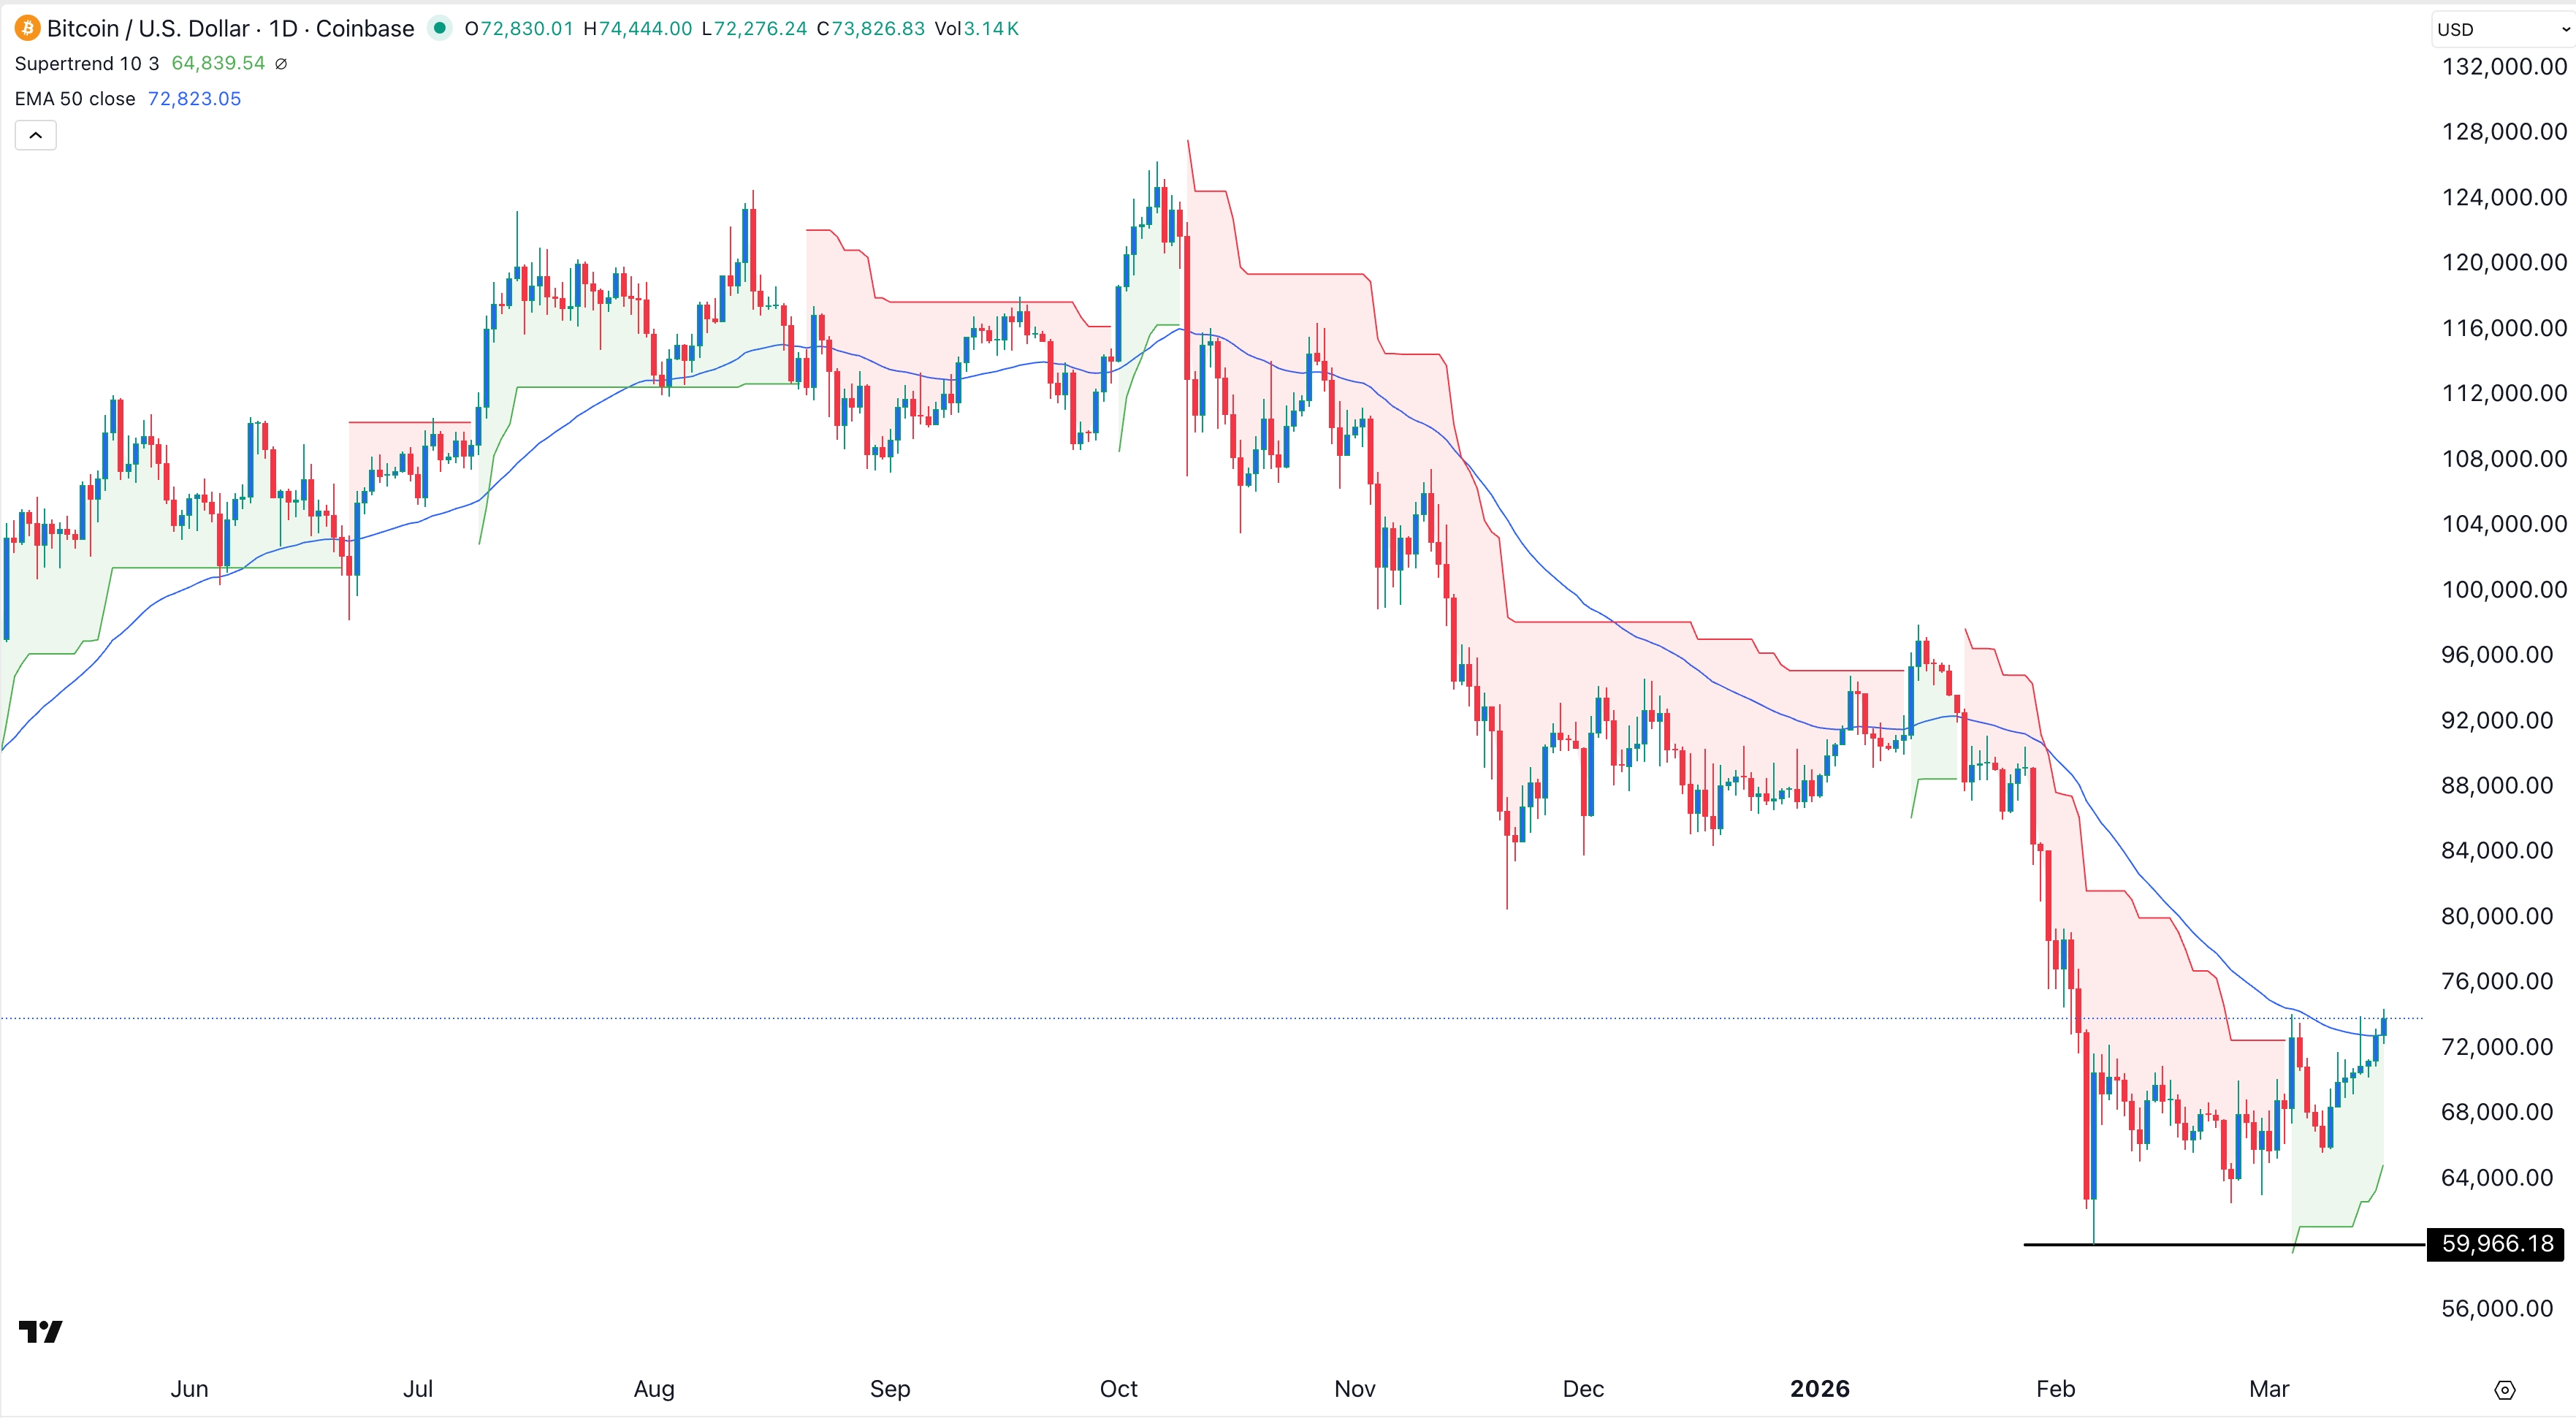
BTC/USD Technical Analysis
The daily timeframe chart shows that the BTC/USD pair has gone sideways in nearly two months. It has formed an ascending channel and is now slightly above its lower side.
The Supertrend indicator has moved from red to green and is now attempting to move above the 50-day Exponential Moving Average (EMA). Also, the Percentage Price Oscillator (PPO) has moved upwards and is attempting to move above the zero line.
Therefore, the pair will likely continue rising as bulls target the next important resistance at 75,000, the upper side of the ascending channel. On the other hand, a drop below the lower side of this channel will point to more downside.