
My previous BTC/USD signal last Thursday produced a profitable long trade from the bullish doji candlestick which rejected the support level at $69,038.
Today’s BTC/USD Signals
Risk 0.50% per trade.
Trades may only be entered before 5pm Tokyo time Tuesday.
Long Trade Ideas
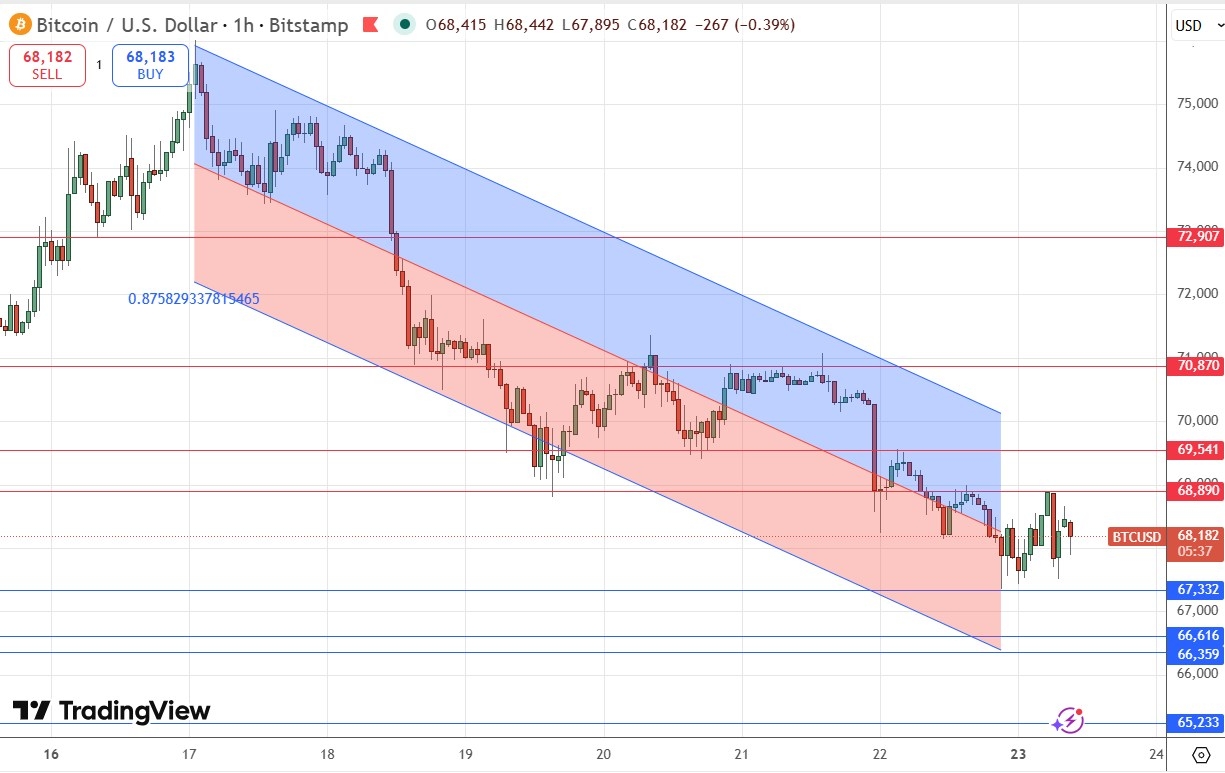
Long entry after a bullish price action reversal on the H1 timeframe following the next touch of $67,332, $66,616, or $66,359.
Put the stop loss $100 below the local swing low.
Adjust the stop loss to break even once the trade is $100 in profit by price.
Remove 50% of the position as profit when the trade is $100 in profit by price and leave the remainder of the position to run.
Short Trade Ideas
Short entry after a bullish price action reversal on the H1 timeframe following the next touch of $68,890, $69,541 or $70,870.
Put the stop loss $100 above the local swing high.
Move the stop loss to break even once the trade is $100 in profit by price.
Remove 50% of the position as profit when the trade is $100 in profit by price and leave the remainder of the position to run.
The best method to identify a classic “price action reversal” is for an hourly candle to close, such as a pin bar, a doji, an outside or even just an engulfing candle with a higher close. You can exploit these levels or zones by watching the price action that occurs at the given levels.
BTC/USD Analysis
In my last BTC/USD forecast last Thursday, I thought that the best trade which might set up would be a short trade $70,870 targeting the support level at $69,038. This did set up the next morning but ended up as a losing trade. However, the earlier long trade which set up first was a winning trade, although the profit was relatively small.
I see the technical picture as continuing to be bearish, as evidenced by:
The linear regression analysis within the price chart below showing a symmetric descending channel, which is largely holding.
Bitcoin’s failed bullish breakout out of its range earlier which failed to even make $75,000 before flopping and heading south again.
The long-term bearish trend.
For these reasons, I see a short trade as the best potential opportunity which might set up, especially from the resistance level at $69,541 as it is confluent both with the upper trend line of the descending price channel and the big round number at $70,000.
By the time the price reaches higher resistance levels, the short-term trend will be broken so the trade would probably be relatively unreliable.
https://www.tradingview.com/chart?symbol=COINBASE%3ABTCUSD
There is nothing of high importance due today regarding either Bitcoin or the US Dollar.
Ready to trade our daily Forex signals? Here is our list of the best MT4 crypto brokers worth reviewing.