
Bullish view
Buy the BTC/USD pair and set a take-profit at 80,000.
Add a stop-loss at 70,000.
Timeline: 1-2 days.
Bearish view
Sell the BTC/USD pair and set a take-profit at 70,000.
Add a stop-loss at 80,000.
The BTC/USD pair continued its strong uptrend as it jumped to the highest level since February 4. It rose to 75,000, up by 25% from its lowest level this year.
Bitcoin Rises Amid Risk-On Sentiment
The BTC/USD pair continued rising as investors embraced a risk-on sentiment in the market as oil prices retreated. Brent, the global benchmark, dropped from $105 on Monday to $100, while the West Texas Intermediate (WTI) dropped to $93.
Crude oil prices dropped after President Donald Trump pressed more countries to help secure the Strait of Hormuz, where 20% of all crude oil passes through. It is unclear whether more countries will help to do that as Donald Trump started this war with Israel.
Bitcoin has also done well as ETFs continued getting inflows, a sign that investors are starting to appreciate the role of Bitcoin as a safe-haven asset. Spot Bitcoin ETFs have added over $1.5 billion in inflows this month despite the ongoing crisis in the Middle East. It is the first month that the coin has had inflows in five months.
Bitcoin is also benefiting from the recent Strategy accumulation. The company bought over 20,000 coins last week, bringing its total holdings to 761,068 coins that are now valued at over $56 billion.
Looking ahead, the BTC/USD pair will react to the upcoming Federal Reserve interest rate decision, which will come out on Wednesday this week. Economists expect the bank to leave its interest rates unchanged between 3.50% and 3.75%. Lower oil prices, if the trend continues, may push the Fed to cut rates later this year.
BTC/USD Technical Analysis
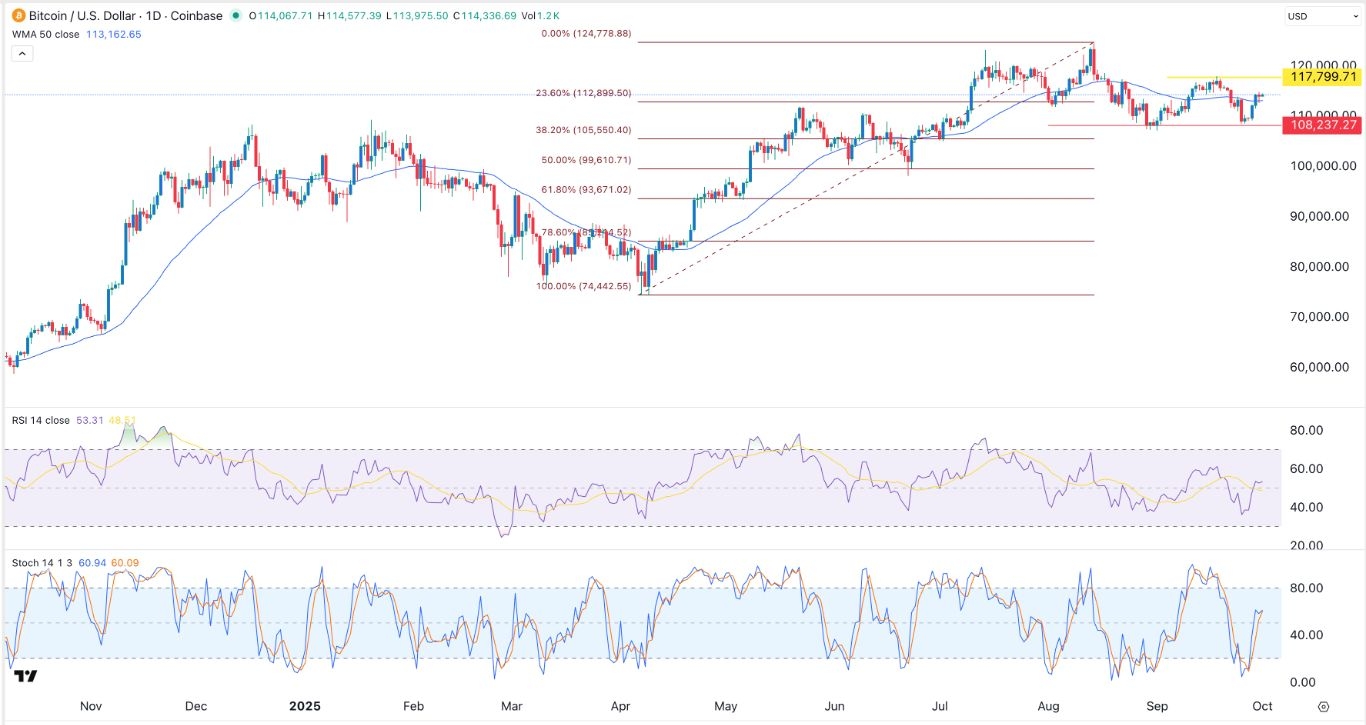
The daily timeframe chart shows that the BTC/USD pair bottomed at 60,000 in February to a high of 75,000 today. It crossed the important resistance level at 74,040, its highest swing this month.
The pair has moved above the 50-day Exponential Moving Average (EMA). It has flipped the Supertrend indicator from red to green, a sign that bulls are now in control.
Similarly, the Relative Strength Index (RSI) and the MACD indicators have been rising. The RSI is nearing the overbought level.
Therefore, the pair will likely continue rising as bulls target the next key resistance level at 80,000. A move below the key support level at 70,000 will invalidate the bullish outlook.