
Bullish view
Buy the BTC/USD pair and set a take-profit at 74,000.
Add a stop-loss at 68,000.
Timeline: 1-2 days.
Bearish view
Sell the BTC/USD pair and set a take-profit at 68,000.
Add a stop-loss at 74,000.
Bitcoin price firmed on Monday, holding steady despite the ongoing Iran crisis. The BTC/USD pair was trading at 71,500, up substantially from the year-to-date low of 60,000.
Bitcoin's Role as a Safe-Haven Returns
The BTC/USD pair rose as investors reacted to the rising hope that Bitcoin was becoming a safe-haven asset. Bitcoin has done better than other assets, including the stock market. It has risen as key indices like the Dow Jones and S&P 500 dropped to the lowest level in weeks.
Another sign of Bitcoin's role as a safe-haven is that demand for spot Bitcoin ETFs continues rising. Data shows that these funds had inflows worth over $767 million last week. It was the third consecutive week of gains, with the monthly increase being over $1.3 billion. This is notable as the funds shed assets in the previous four consecutive months.
Bitcoin has also done well amid the ongoing accumulation by Strategy, formerly known as MicroStrategy. Michael Saylor hinted that the company continued buying Bitcoin last week. It now holds over 737,730 coins worth over $52 billion.
The next key catalyst for the BTC/USD pair will be the upcoming Federal Reserve interest rate decision, which will come out on Wednesday this week. Economists expect the Federal Reserve to maintain interest rates unchanged between 3.50% and 3.75%.
The bank will react to the recent data, which showed that the economy lost 92,000 jobs, while the unemployment rate rose to 4.4%.
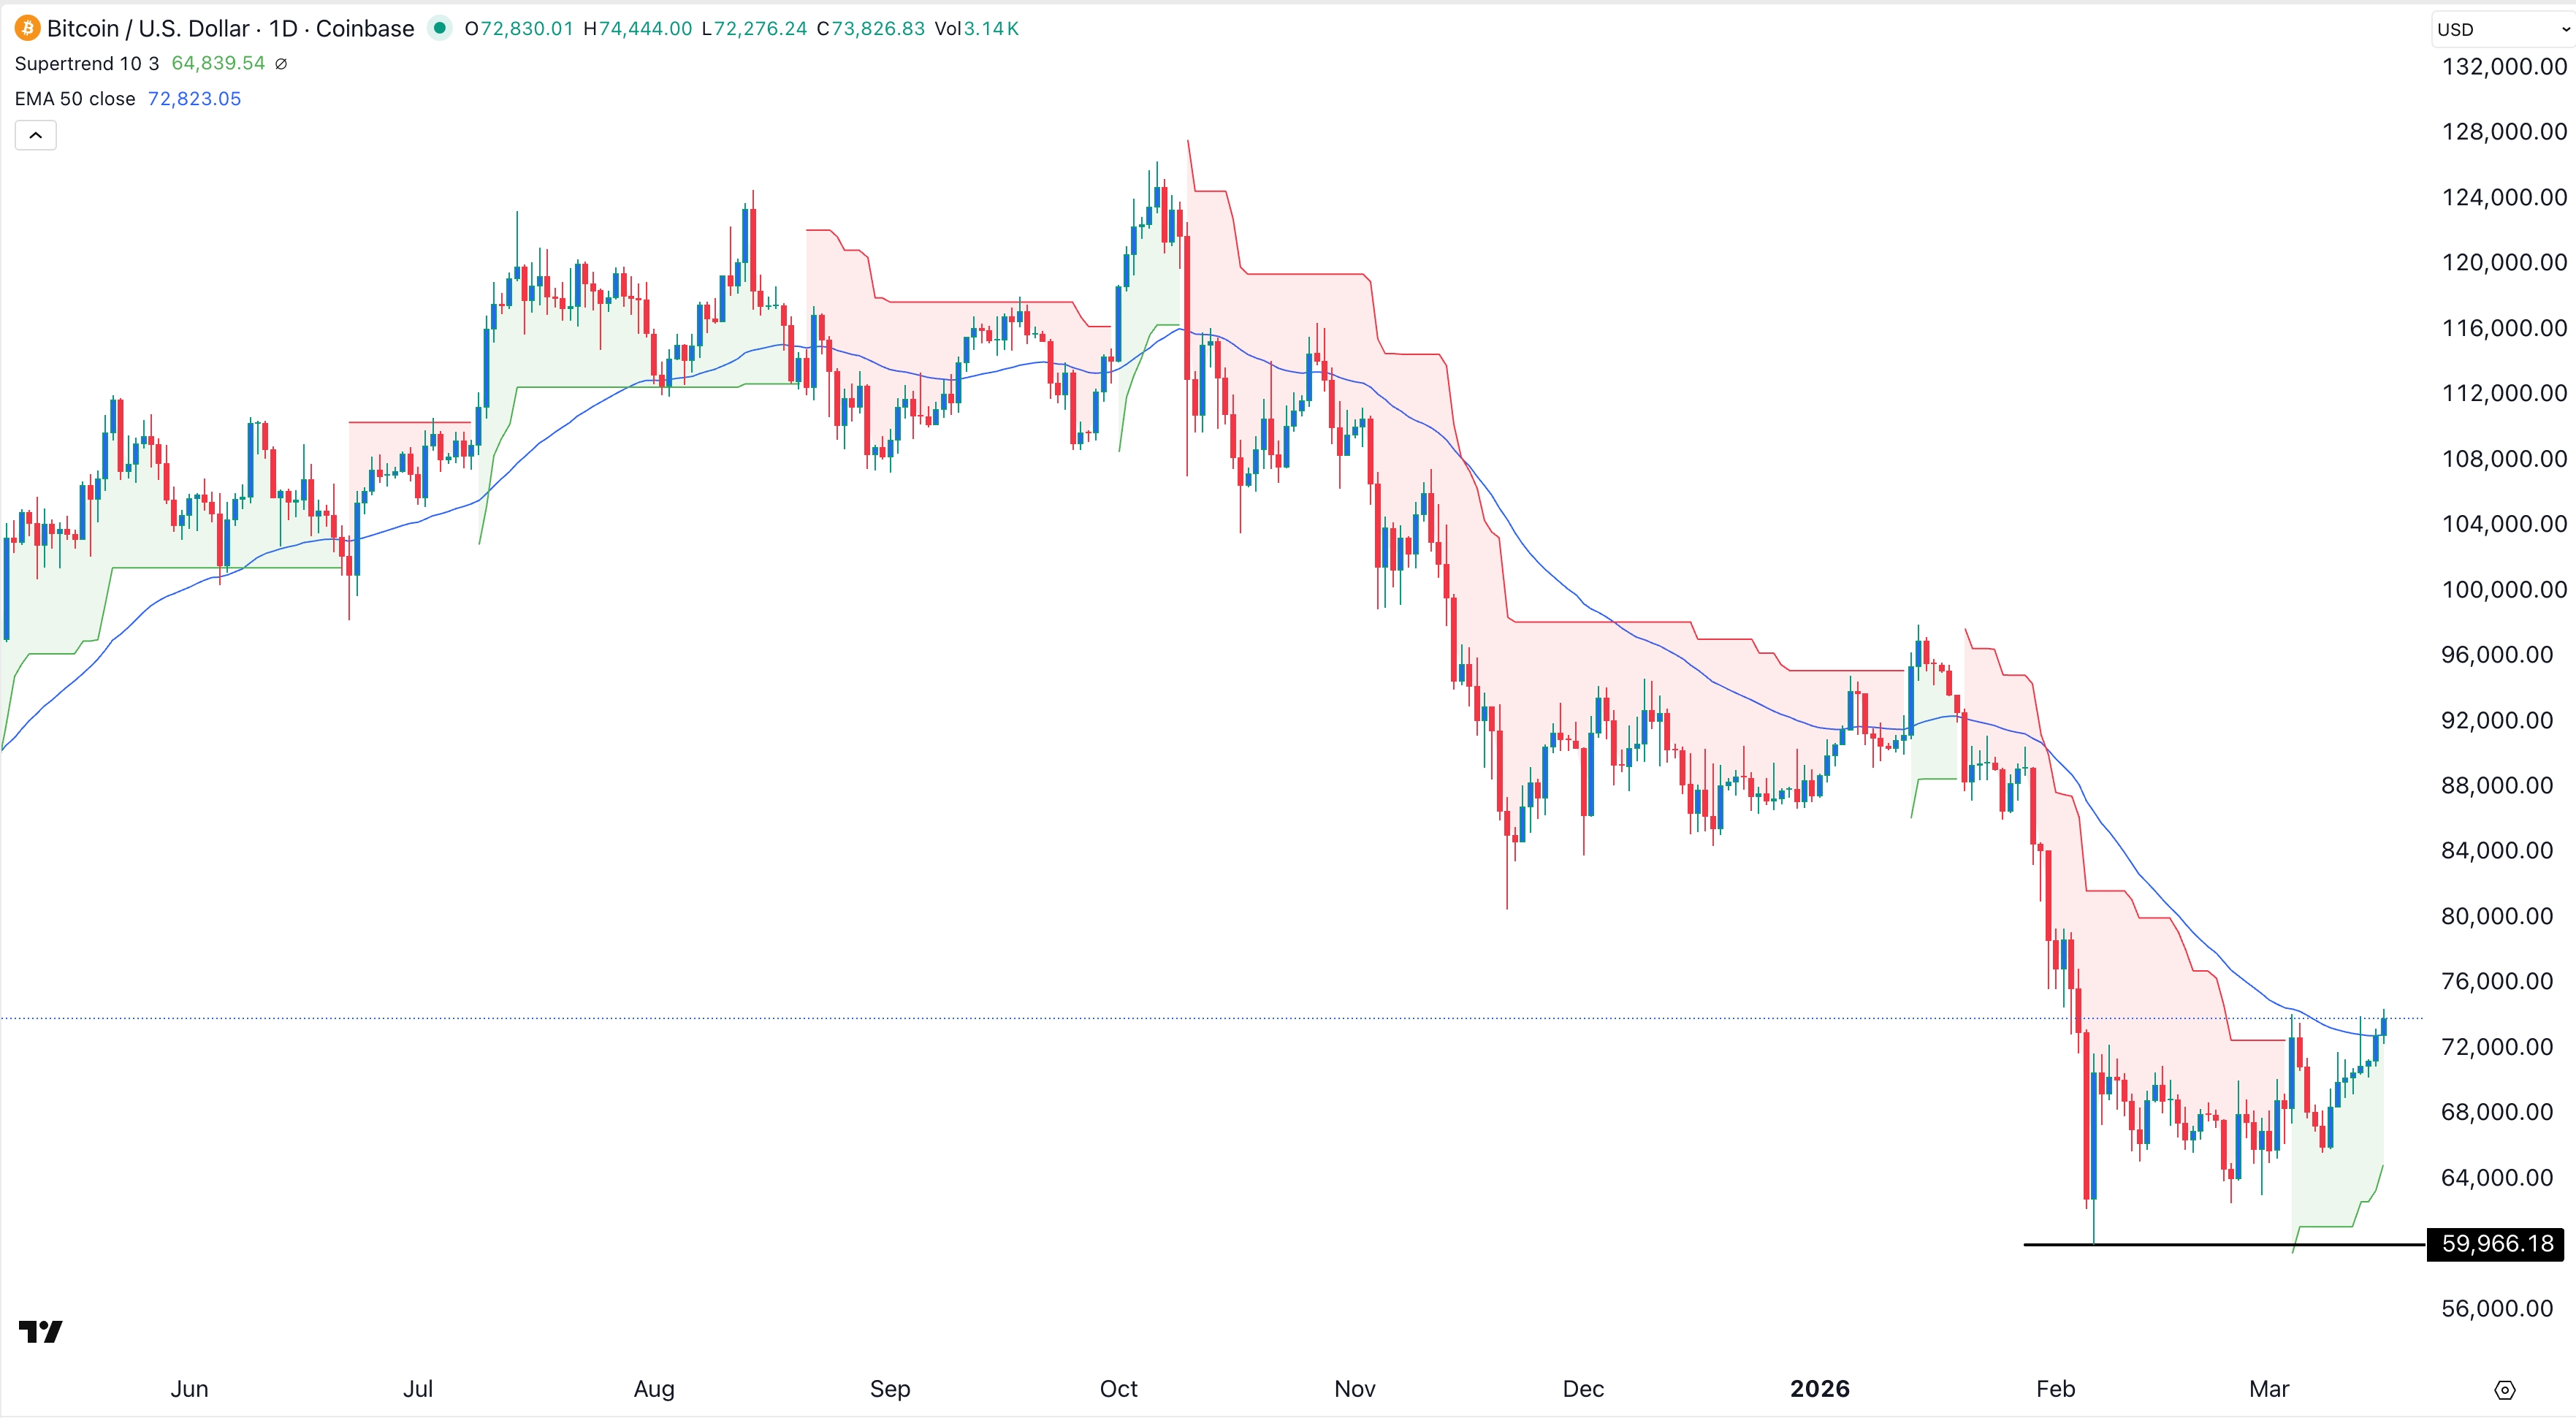
BTC/USD Technical Analysis
The daily chart shows that the BTC/USD pair has jumped from the year-to-date low of 60,000 in February to 71,500 today. Notably, the pair’s Supertrend indicator has turned green, which is a bullish sign in technical analysis.
The coin has jumped above the 50-day Exponential Moving Average (EMA). Also, the Relative Strength Index (RSI) has crossed the neutral point at 50 and is pointing upwards. The Percentage Price Oscillator has also jumped and is nearing the zero line.
Therefore, the pair will likely continue rising as bulls target the key resistance level at 74,000. On the other hand, a move below the 25-day moving average will invalidate the bullish outlook.