
Bearish view
Sell the BTC/USD pair and set a take-profit at 65,000.
Add a stop-loss at 74,000.
Timeline: 1-2 days.
Bullish view
Buy the BTC/USD pair and set a take-profit at 74,000.
Add a stop-loss at 65,000.
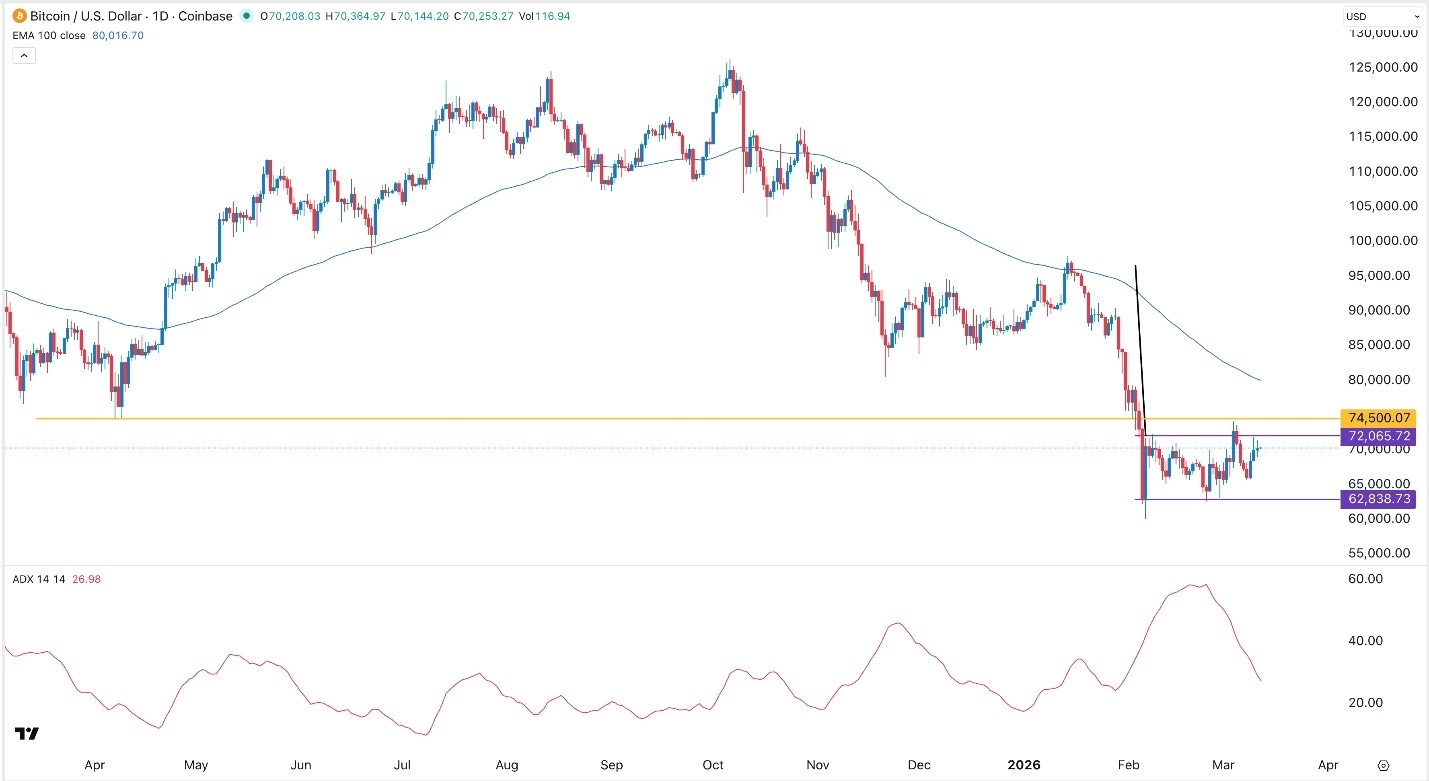
The BTC/USD pair rose to 70,200 on Thursday, remaining inside a range where it has been at in the past 30 days. Bitcoin was reacting to the latest US consumer inflation report and the performance in the crude oil market.
US inflation and Oil Price Gains
The BTC/USD pair rose as market participants reacted to the latest US consumer inflation report, which came out on Wednesday. A report showed that the headline Consumer Price Index (CPI) jumped 2.4%, while the core CPI rose 2.5% in February.
Still, inflation will likely continue rising in the foreseeable future as energy prices jump. Data shows that Brent and the West Texas Intermediate (WTI) jumped to $93 overnight after Iran’s military changed its strategy. In a statement, the IRGC said that it will focus on continuous strike, which will push oil prices to $200.
Oil prices jumped even after the US and other IEA member states pledged to release millions of barrels of oil. The US will release 172 million barrels, while the other IEA members will release 228 million. Still, these releases will cover a portion of the 11-16 million barrels of supply being lost each day.
Bitcoin price has also held steady as exchange-traded funds (ETF) continued adding assets. These assets have added over $1 billion this month, continuing a trend that has been going on this month. Rising inflows is a sign that American investors are still in an accumulation mode.
BTC/USD Technical Analysis
While Bitcoin has risen recently, it has remained inside a narrow range in the last month. It has remained inside the support and resistance levels at $62,838 and $72,065.
The BTC/USD pair has formed a large bearish flag pattern, which is made up of a large vertical line and a horizontal channel. It has remained below the important support level at 74,500, its lowest level in April last year.
The pair’s Average Directional Index (ADX) has dropped to the lowest level since February, a sign that the uptrend is continuing.
Therefore, the bearish outlook may push it to the next key target at 62,840, its lowest point in February. A move below that level will point to more downside, potentially to the key support level at 60,000.