
Bullish view
Buy the AUD/USD pair and set a take-profit at 0.7200.
Add a stop-loss at 0.6950.
Timeline: 1-2 days.
Bearish view
Sell the AUD/USD pair and set a take-profit at 0.6950.
Add a stop-loss at 0.7200.
The AUD/USD exchange rate stabilized as the US dollar pared back some of the recent gains. It also rebounded after Australia released strong Australia GDP data. It was trading at 0.7075, much higher than this week’s low o.6945.
US Non-Farm Payrolls Data
The AUD/USD pair rebounded after Australia published strong GDP data, raising the possibility that the RBA will deliver an interest rate hike in the coming meetings.
A report showed that the economy grew by 0.8% in the fourth quarter after growing by 0.5% in the third one. This growth led to an annual growth rate of 2.6%, higher than the previous 2.1%. These numbers were much better than expected.
More data released on Thursday showed that the country’s exports and imports rose in January. It recorded a A$4 billion trade surplus in January as demand for commodities jumped. Household consumption also continued rising.
The next key AUD/USD news will be the upcoming US non-farm payrolls (NFP) data, which will come out on Friday. A report released on Wednesday showed that the private sector created over 63k jobs, higher than the expected 50k.
Economists expect the official NFP report to show that the economy added over 70k jobs in February after adding 110k in the previous month. Based on the recent data, there is a possibility that the BLS will reduce the January jobs additions data.
A strong jobs report may push the Fed to maintain interest rates steady for longer. Besides, there are signs that inflation will remain steady for longer than expected because of the rising crude oil prices. Brent, the global benchmark, has jumped to over $83, and this trend may continue as the war continues.
AUD/USD Technical Analysis
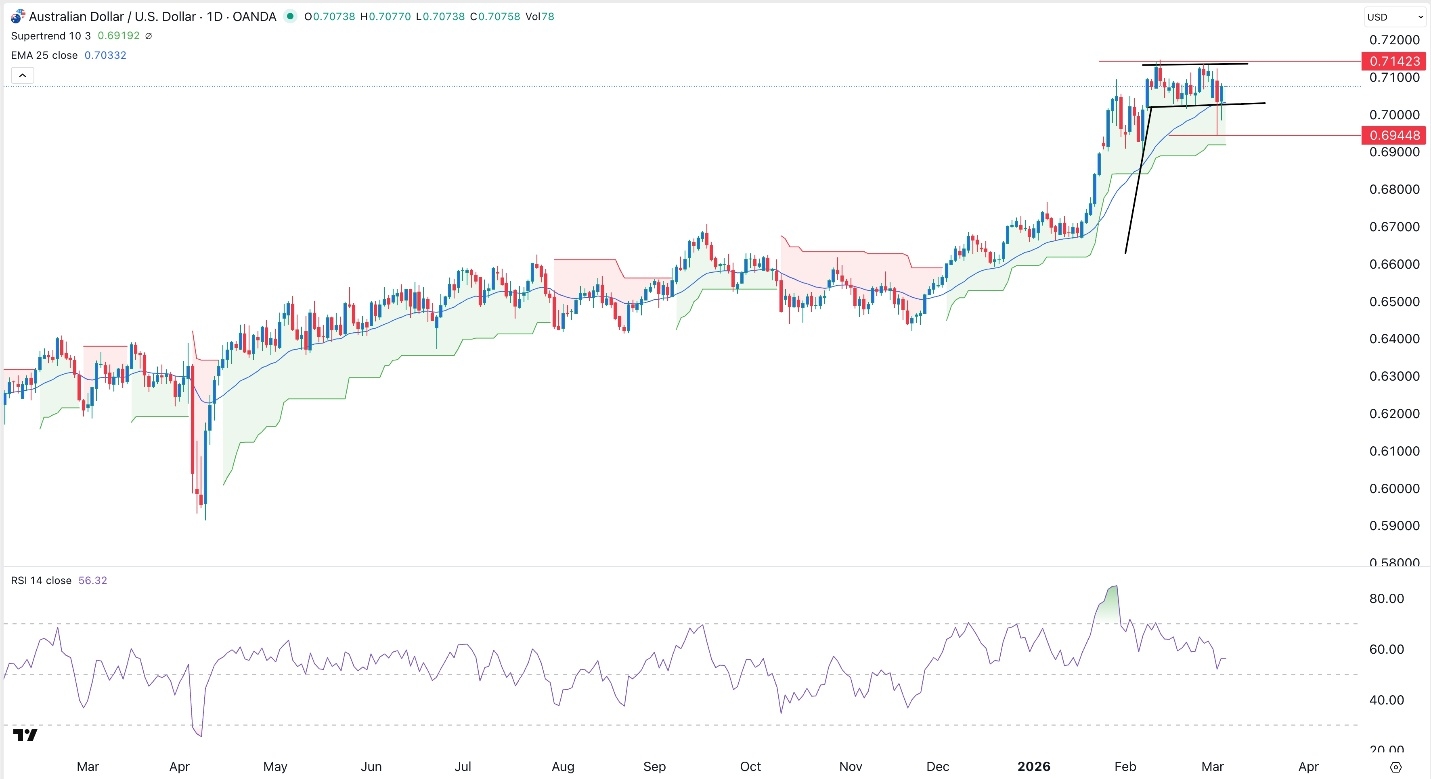
The daily chart shows that the AUD/USD pair retreated to 0.6945 on Tuesday and then bounced back as the US dollar retreated. It has formed a harami candlestick pattern, where a small bullish candle follows a big bearish one. It is a common continuation sign in technical analysis.
The pair has also formed a bullish flag pattern. It also remains slightly above the 50-day moving average and the Supertrend indicator.
Therefore, the pair will likely continue rising in the near term. More gains will be confirmed if it moves above the year-to-date high of 0.7143. A move above that level will point to more gains, potentially to the psychological level at 0.7200.