
Bullish view
Buy the AUD/USD pair and set a take-profit at 0.7250.
Add a stop-loss at 0.6950.
Timeline: 1-2 days.
Bearish view
Sell the AUD/USD pair and set a take-profit 0.6950.
Add a stop-loss at 0.7250.
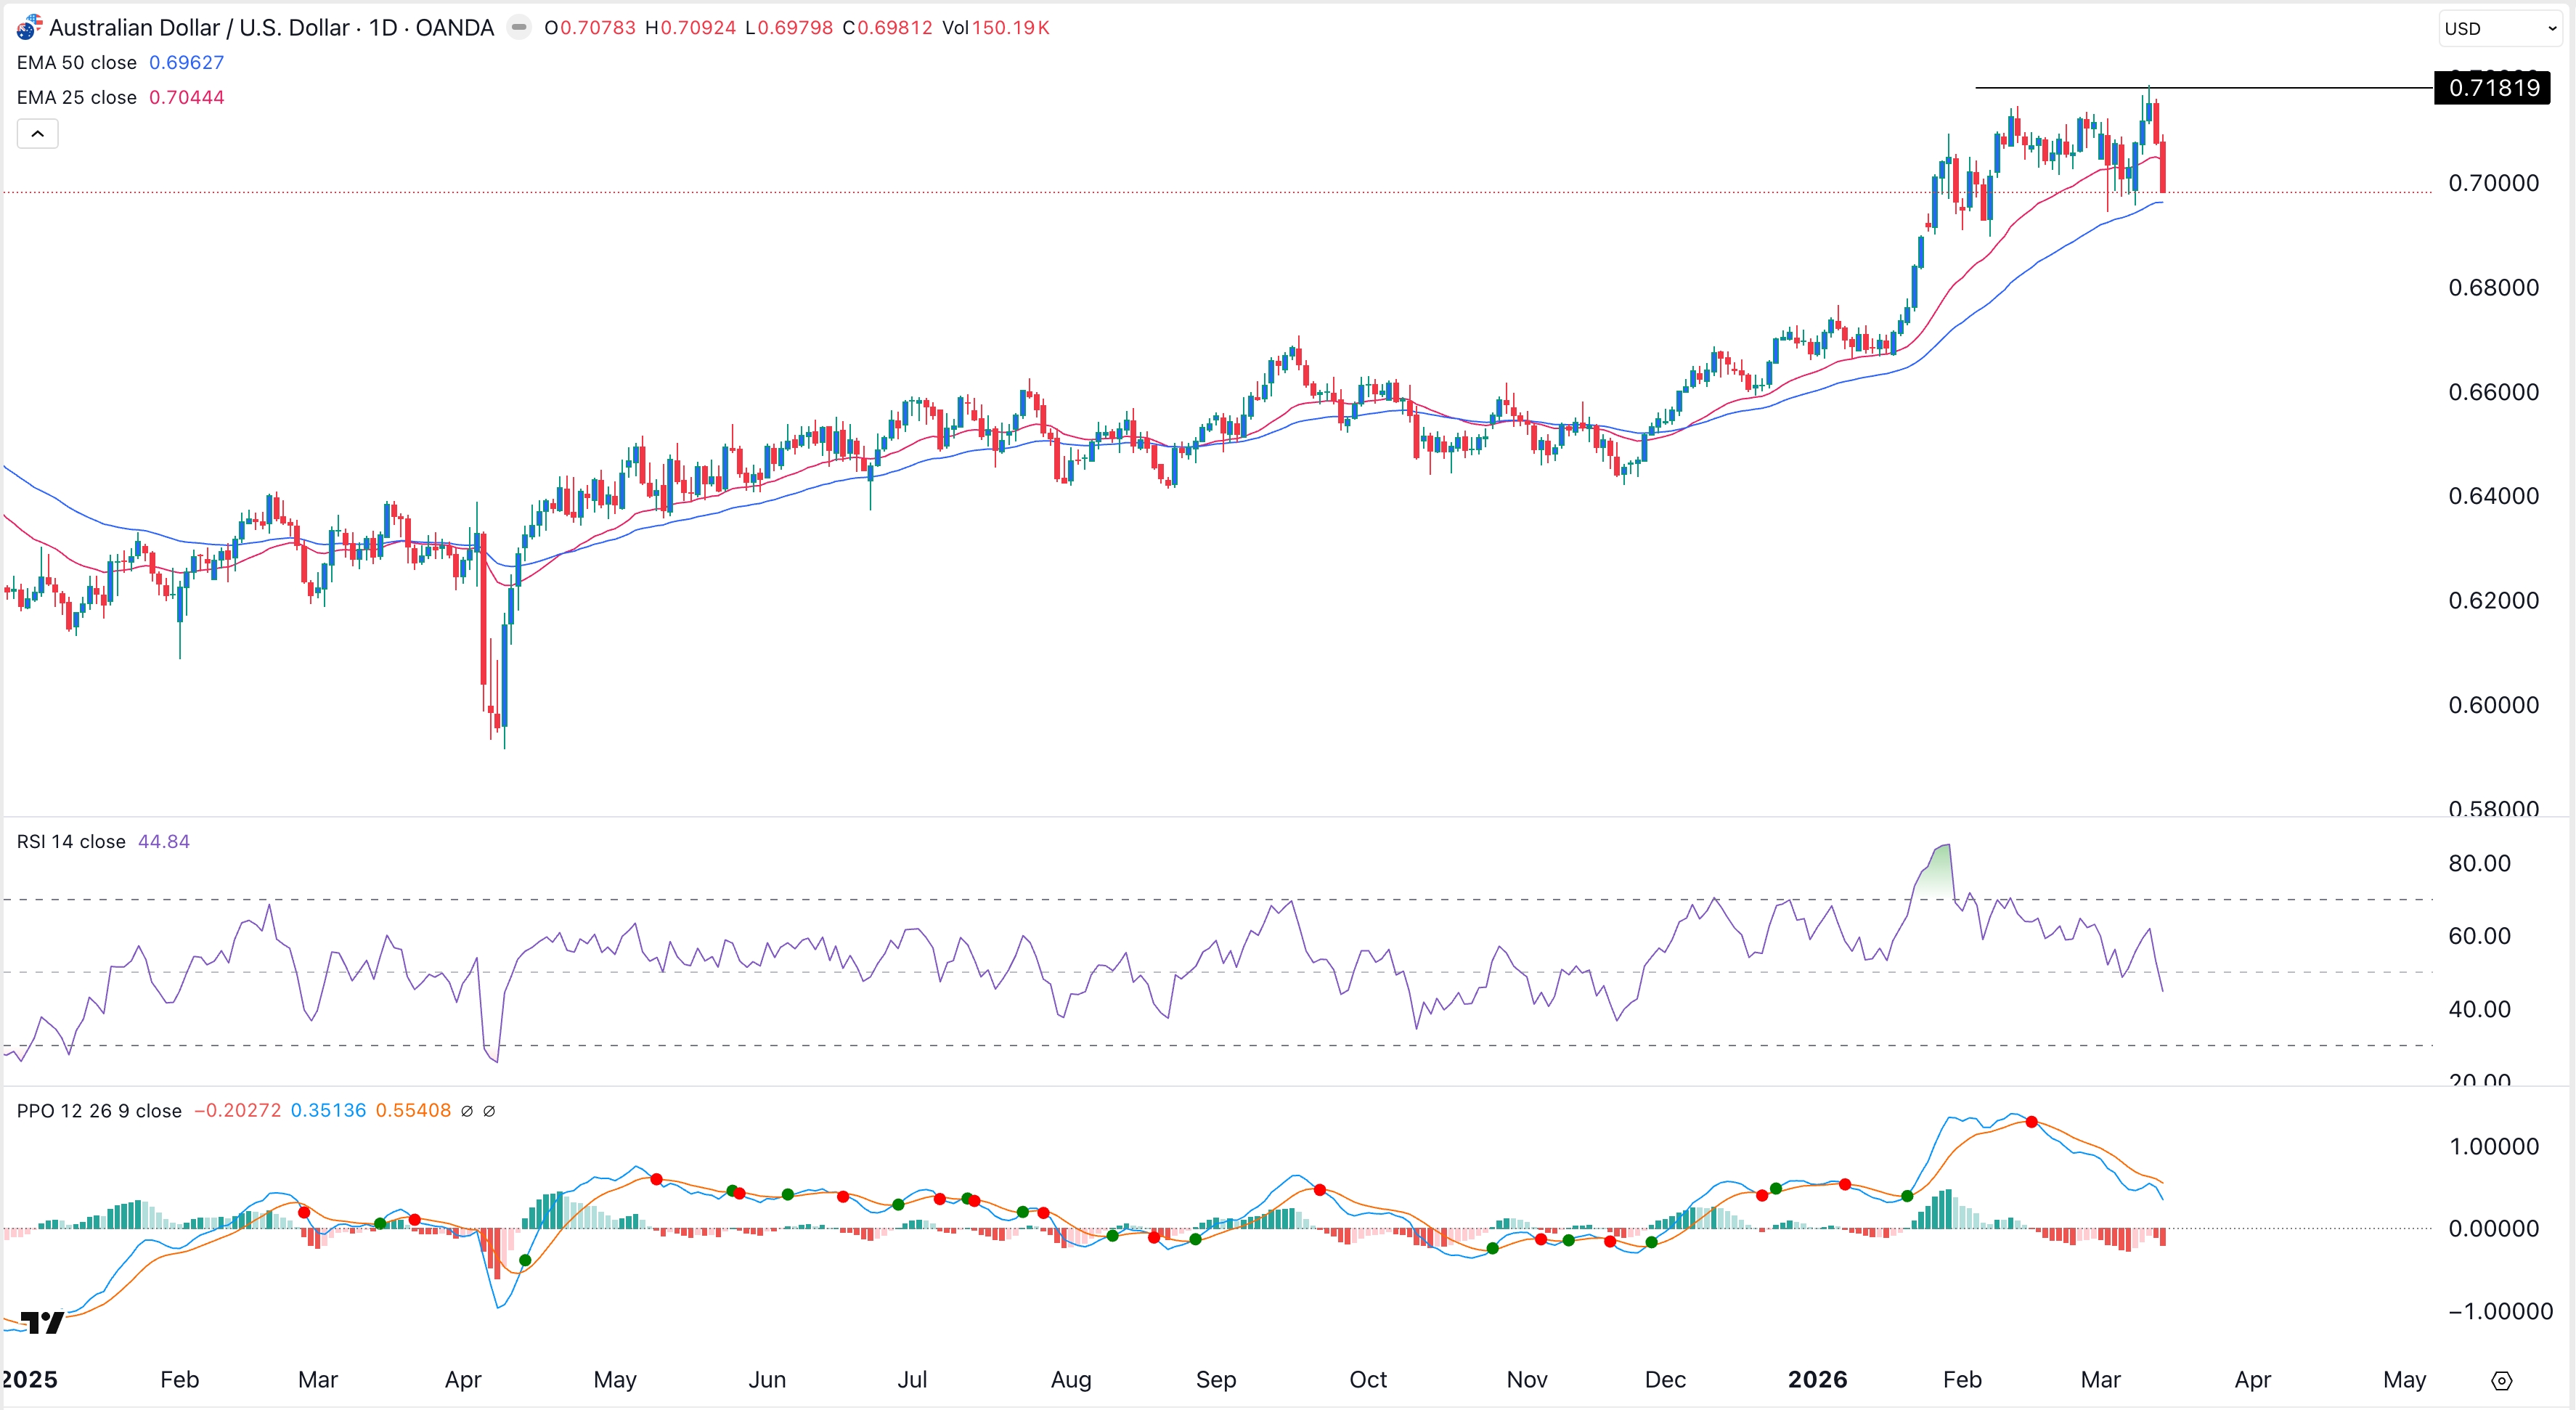
The AUD/USD exchange rate has remained in a narrow range since February. It was trading at 0.7020 on Monday, a few points below the year-to-date high of 0.7180.
Australia Inflation Report Ahead
The AUD/USD pair wavered after the Federal Reserve and Reserve Bank of Australia (RBA) interest rate decisions last week.
In its interest rate decision on Tuesday, the bank decided to hike interest rates for the second consecutive meeting, bringing the benchmark rate to 4.1%, its highest level since May last year.
The bank cited the elevated inflation for its decision to increase interest rates. Economists expect the upcoming consumer inflation report to show that the headline CPI rose 3.8% in February. The weighted and trimmed mean CPIs rose 3.6% and 3.4% in the same period.
If these estimates are correct, it means that inflation has continued to move away from the RBA’s target of between 2% and 3%. Inflation will likely continue rising in the coming months because of the soaring crude oil and natural gas prices. Analysts expect that the bank may deliver another rate hike in the next meeting.
The AUD/USD pair also wavered after the Federal Reserve delivered a moderately hawkish interest rate decision on Wednesday last week. It left interest rates unchanged between 3.50% and 3.75% and hinted that it hold rates steady in the foreseeable future. This decision came on the same day that the Producer Price Index (PPI) remained above 3% in February.
There will be no major macro data from the United States this week. As a result, traders will focus on the new developments in Iran, where the US and Israel have launched an attack.
AUD/USD Technical Analysis
The daily chart shows that the AUD/USD pair has moved sideways in the past two months. It has formed a channel and is in the process of forming a bullish flag pattern. A bullish flag is a common continuation sign in technical analysis.
The pair has remained above the 50-day and 100-day Exponential Moving (EMA). It has also remained above the Supertrend indicator.
Therefore, the pair will likely have a strong bullish breakout in the coming days, potentially to the year-to-date high of 0.7180. A move above that level will point to more gains, potentially to the key resistance level at 0.7250.