

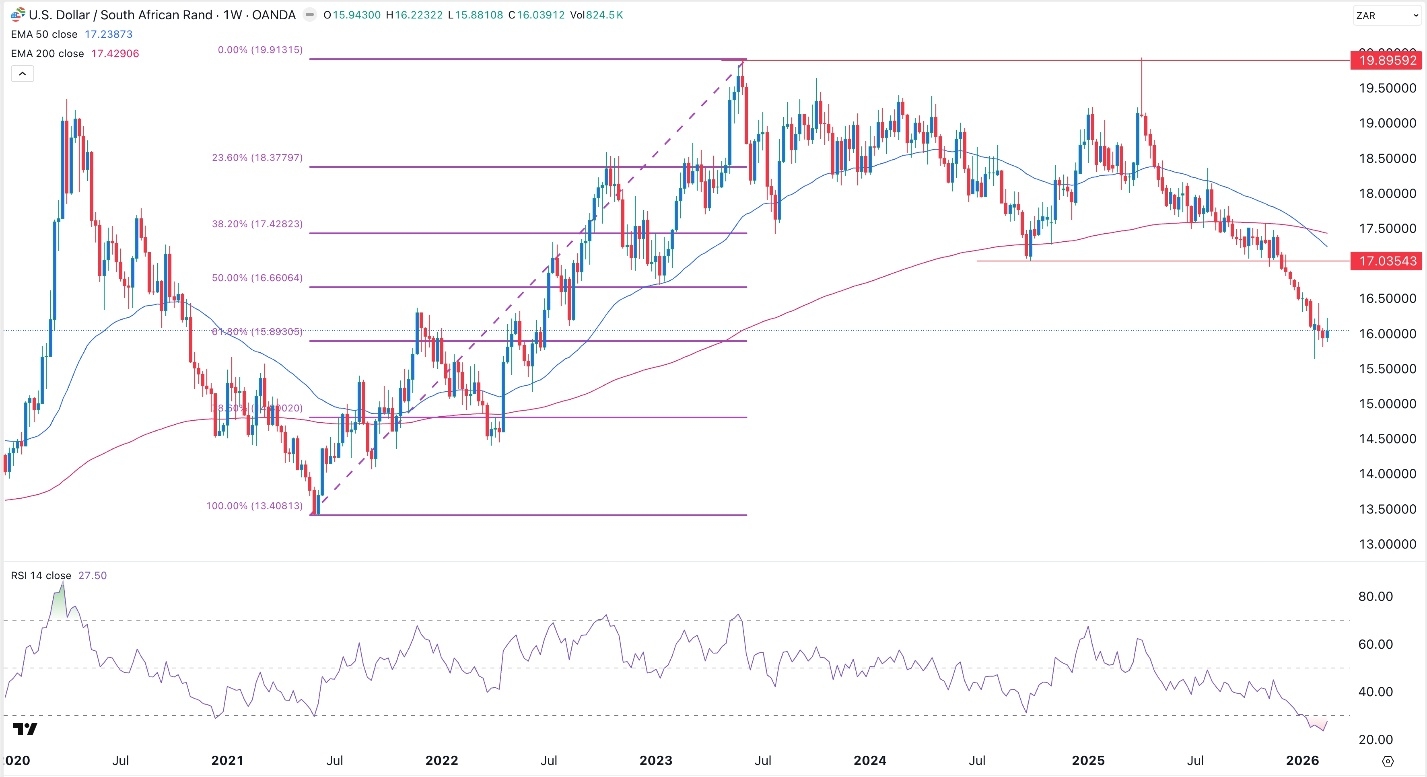
The South African rand has rebounded in the past 12 months, making it one of the best-performing currencies globally. The USD/ZAR exchange rate was trading at 16.04, down sharply from last year's high of 19.93. This retreat may continue after the pair formed a death cross pattern.
South African Rand Rally May Continue
The USD/ZAR pair moved sideways last week as investors reacted to the Supreme Court decision on Donald Trump's tariffs. In a 6-3 ruling, the majority, led by Chief Justice John Robert, said that Donald Trump erred when he used the Emergency Powers Act to levy tariffs on all imports.
South Africa’s economy will benefit from that ruling as Trump put in place a 30% tariff on goods from the country, a move that economists predicted would have a 0.4% impact on the economy.
Goods coming from South Africa will now be levied a 15% tariff, which Donald Trump announced on Saturday, better than the previous 30%.
Meanwhile, recent macro data shows that the South African economy has continued its recovery, helped by the political alliance between the African National Congress (ANC) and the Democratic Alliance (DA). That alliance has led to more political stability in South Africa, while the perennial load-shedding has ended.
At the same time, the economy is benefiting from the recent gold price surge. While gold production has dropped in the past few decades, the surge in prices means that it is making more money.
The next key catalysts for the USD/ZAR pair will be macro data from the United States. For example, the Conference Board will publish the latest consumer confidence report on Tuesday, while the Bureau of Labor Statistics will release the latest producer price index (PPI) data.
At the same time, so to top Federal Reserve officials like Raphael Bostic, Michele Bowman, and Thomas Barkin will talk and deliver their estimates on what the Federal Reserve will do this year.
USD/ZAR Technical Analysis
The weekly timeframe chart shows that the USD/ZAR exchange rate has been in a strong downward trend in the past few months. It has slumped from a high of 19.93 in April last year to the current 16.03. It formed a double-top pattern at 19.93 and a neckline at 17.03, its lowest level in September last 2024.
The pair has formed a death cross pattern, which happens when the 50-week and 200-week Exponential Moving Averages (EMA) cross each other. Also, it is nearing the 61.8% Fibonacci Retracement level at 15.8.
It remains below the Supertrend indicator, while the Relative Strength Index (RSI) has continued moving downwards.
Therefore, the pair will likely continue falling, with the next key support level being at 15.0