
Tesla (TSLA) stock signal, a fundamental snapshot, and a technical view on where its share price is heading. What to know before the market opens on February 2nd, 2026, after TSLA closed at $430.41, up 3.32% during the previous session, before sliding 0.18% in after-market hours.
Short Trade Idea
Enter your short position between $414.62 (the post-earnings intra-day low) and $430.41 (Friday’s close).
Market Index Analysis
- Tesla (TSLA) is a member of the NASDAQ 100, the S&P 100, and the S&P 500 index.
- All three indices are retreating from all-time highs with accumulating bearish factors.
- The Bull Bear Power Indicator of the NASDAQ 100 turned bearish with a descending trendline.
Market Sentiment Analysis
Equity futures are pointing lower this morning, as markets continue to digest Kevin Warsh as President Trump’s Federal Reserve pick. Earnings season, especially in technology, has been mixed to date. Investors will receive over 100 S&P 500 releases this week. Market-moving earnings reports will come from Amazon, Alphabet, Disney, Palantir, and Advanced Micro Devices. The aggressive precious metals sell-off grabs headlines, and Friday’s NFP report could inject more volatility. The brutal Bitcoin sell-off is also adding to selling pressure.
Tesla Fundamental Analysis
Tesla is one of the world’s most valuable companies by market capitalization, but it faces stiff competition from Chinese rivals. Expiring EV credits add to declining market share and shrinking profit margins.
So, why am I bearish on TSLA following its earnings release?
Tesla reported revenues of $24.90 billion and earnings per share of $0.50, beating expectations of $24.79 and $0.45, respectively. Still, I remain bearish after TSLA reported its second consecutive annual delivery decline and lost market share to BYD, Xiaomi, NIO, and other competitors. It also stakes its future on Cybercab robotaxis and Optimus humanoid robots, for which it will retool one of its manufacturing plants. Still, they are years away from being income-generating products. In the meantime, Tesla is losing brand loyalty and market dominance, while valuations remain sky-high. Its subscription-based software pivot is equally disappointing, with a 12% adoption rate.
Metric | Value | Verdict |
P/E Ratio | 398.53 | Bearish |
P/B Ratio | 19.66 | Bearish |
PEG Ratio | 6.44 | Bearish |
Current Ratio | 2.16 | Bullish |
ROIC-WACC Ratio | Negative | Bearish |
Tesla Fundamental Analysis Snapshot
The price-to-earning (P/E) ratio of $398.53 makes TSLA an expensive stock. By comparison, the P/E ratio for the NASDAQ 100 is 35.11.
The average analyst price target for TSLA is $418.89, suggesting no upside potential with rising downside risks.
Tesla Technical Analysis
Today’s TSLA Signal
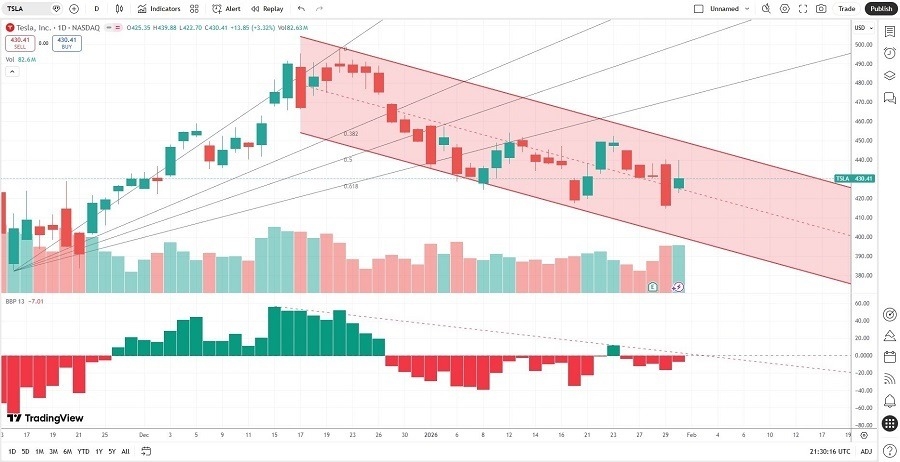
Tesla Price Chart
- The TSLA D1 chart shows price action inside a bearish price channel.
- It also shows price action breaking down below its ascending Fibonacci Retracement Fan.
- The Bull Bear Power Indicator is bearish with a descending trendline.
- The average bearish trading volumes are higher than the average bullish trading volumes.
- TSLA corrected more than the NASDAQ 100 Index, a bearish confirmation.
My TSLA Short Stock Trade
- TSLA Entry Level: Between $414.62 and $430.41
- TSLA Take Profit: Between $297.82 and $314.60
- TSLA Stop Loss: Between $465.83 and $481.77
- Risk/Reward Ratio: 2.28
Ready to trade our analysis of Tesla? Here is our list of the best stock brokers worth reviewing.