
Microsoft (MSFT) stock signal, a fundamental snapshot, and a technical view on where its share price is heading. What to know before the market opens on February 2nd, 2026, after MSFT closed at $430.29, down 0.74% during the previous session, before sliding 0.34% in after-market hours.
Long Trade Idea
Enter your long position between $426.45 (Friday’s intra-day low) and $438.68 (the upper band of its horizontal support zone).
Market Index Analysis
- Microsoft (MSFT) is a member of the NASDAQ 100, the Dow Jones Industrial Average, the S&P 100, and the S&P 500 indices.
- All four indices are retreating from all-time highs with accumulating bearish factors.
- The Bull Bear Power Indicator of the NASDAQ 100 Index turned bearish with a descending trendline.
Market Sentiment Analysis
Equity futures are pointing lower this morning, as markets continue to digest Kevin Warsh as President Trump’s Federal Reserve pick. Earnings season, especially in technology, has been mixed to date. Investors will receive over 100 S&P 500 Index releases this week. Market-moving earnings reports will come from Amazon, Alphabet, Disney, Palantir, and Advanced Micro Devices. The aggressive precious metals sell-off grabs headlines, and Friday’s NFP report could inject more volatility. The brutal Bitcoin sell-off is also adding to selling pressure.
Microsoft Fundamental Analysis
Microsoft is the largest software maker, one of the most valuable public companies, and one of the most valuable brands globally. It is a significant player in cloud services, gaming, and AI, following its massive investment in OpenAI.
So, why am I bullish on MSFT despite its two-day post-earnings plunge?
Microsoft reported revenues of $81.27 billion and earnings per share of $5.16, beating expectations of $80.3 billion and $3.92, respectively. Still, shares nosedived after its cloud unit, Azure, and its Windows unit, as well as 365 Copilot, disappointed some investors. I remain bullish about its excellent cloud and AI positions, strategic partnerships, and excellent profit margins. The correction lowered valuations, making Microsoft an attractive AI and cloud computing stock.
Metric | Value | Verdict |
P/E Ratio | 26.96 | Bullish |
P/B Ratio | 8.17 | Bearish |
PEG Ratio | 1.70 | Bullish |
Current Ratio | 1.39 | Bearish |
ROIC-WACC Ratio | Positive | Bullish |
Microsoft Fundamental Analysis Snapshot
The price-to-earning (P/E) ratio of 26.96 makes MSFT an inexpensive stock. By comparison, the P/E ratio for the NASDAQ 100 Index is 35.11.
The average analyst price target for MSFT is $599.58. This suggests an excellent upside potential and decreasing downside risk.
Microsoft Technical Analysis
Today’s MSFT Signal
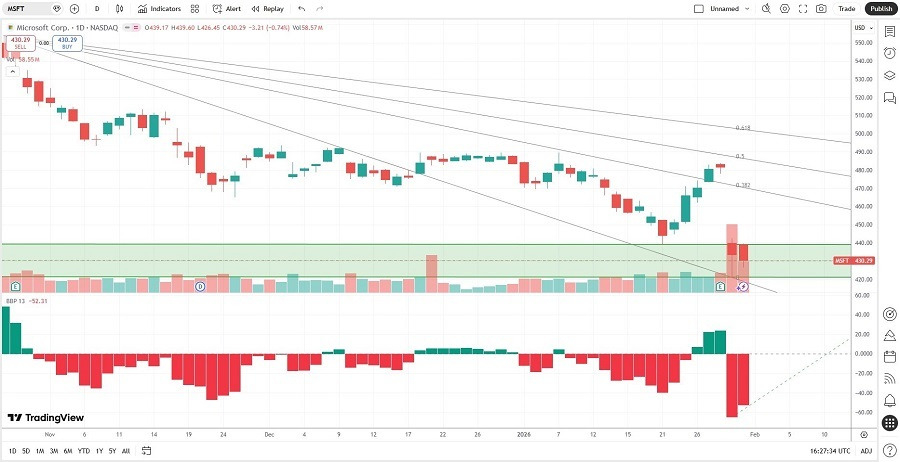
Microsoft Price Chart
- The MSFT D1 chart shows price action inside a significant horizontal support zone.
- It also shows price action between its descending 0.0% and 38.2% Fibonacci Retracement Fan levels.
- The Bull Bear Power Indicator turned bearish with an ascending trendline.
- The average bearish trading volumes during the correction spiked, suggesting a washout.
- MSFT dropped with the NASDAQ 100 Index, a bearish confirmation, but bullish factors dominate.
My MSFT Long Trade
- MSFT Entry Level: Between $426.45 and $438.68
- MSFT Take Profit: Between $513.50 and $525.23
- MSFT Stop Loss: Between $396.66 and $404.51
- Risk/Reward Ratio: 2.92
Ready to trade our analysis of Microsoft? Here is our list of the best stock brokers worth reviewing.