

Bearish view
Sell the BTC/USD pair and set a take-profit at 64,000.
Add a stop-loss at 72,000.
Timeline: 1-2 days.
Bullish view
Buy the BTC/USD pair and set a take-profit at 72,000.
Add a stop-loss at 64,000.
Bitcoin price resumed its strong rebound as market participants embraced a risk-on sentiment and as investors bought the dip. The BTC/USD pair was trading at 68,000 on Thursday, a few points above the year-to-date low of 60,000. It remains much lower than the all-time high of 126,200.
Bitcoin Price Rebounds Amid Dip Buying
The BTC/USD pair bounced back as investors bought the recent dip in the crypto and stock market. Data shows that the market capitalization of all coins jumped by over 5% in the last 24 hours.
Similarly, the stock market rebounded on Wednesday, with the S&P 500 and Nasdaq 100 indices rising by over 300 points, respectively. Also, the US dollar index (DXY) resumed falling on Wednesday.
Bitcoin price rose as third-party data shows that some analysts are buying the dip. For example, data compiled by CoinGlass shows that the futures open interest continued rising, moving to $45 billion, its highest level since February 21. It has jumped from this week's low of $43 billion.
More data shows that spot Bitcoin ETFs had some inflows on Wednesday. Still, these funds have shed billions of dollars in assets in the past few months.
Still, there is a risk that the ongoing Bitcoin rebound is a dead-cat bounce, a situation where an asset in a freefall bounces back briefly and then resumes the downtrend.
BTC/USD Technical Analysis
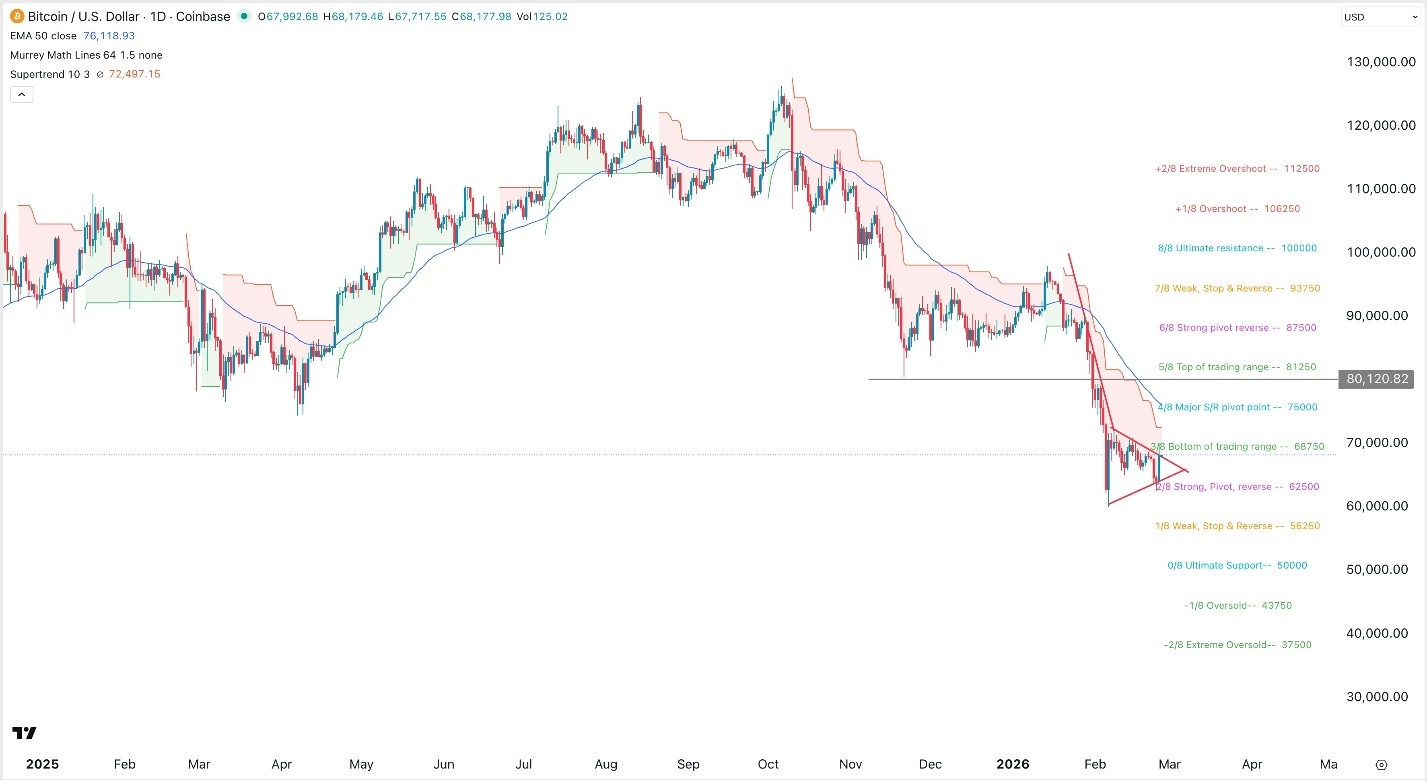
The daily timeframe chart shows that Bitcoin price has remained under pressure in the past few months, moving from a high of 126,300 in October to the current 68,000. It retreated to a low of 63,000 this week and then bounced back on Wednesday and Thursday.
Bitcoin has remained below the important support level at 80,000, its lowest level in November last year. The coin has still formed a bearish pennant pattern, which is made up of a vertical line and a symmetrical triangle.
The BTC/USD pair has remained below the Supertrend and the Ichimoku cloud indicators, a sign that bears are in control.
Therefore, the pair will likely resume the downward trend, possibly to the key support level at 62,500, the Strong, Pivot, Reverse level of the Murrey Math Lines tool. On the other hand, a move above the resistance at 75,000 will invalidate the bearish outlook.