

Bearish view
Sell the BTC/USD pair and set a take-profit at 58,000.
Add a stop-loss at 70,000.
Timeline: 1-2 days.
Bullish view
Buy the BTC/USD pair and set a take-profit at 70,000.
Add a stop-loss at 58,000.
Bitcoin price remained under pressure this week, continuing a downtrend that started in October when it soared to a record high of $126,200. The BTC/USD pair was trading at 64,000 on Wednesday, a few points above this week’s low of 62,915.
Bitcoin Retreats as Key Metrics Drop
The BTC/USD pair retreated as investors as demand waned. Data compiled by SoSoValue shows that demand for Bitcoin ETFs continued waning this month.
The outflows stand at over $1.2 billion this month, continuing a trend that started in November. It shed over $3.4 billion in November, $1.09 billion in December, and $1.61 billion in January this year. They have now lost over $7.3 billion in assets, bringing the cumulative total net inflows to over $53 billion.
More data shows that Bitcoin’s futures open interest has continued falling in the past few months. It has soared from over $95 billion last year to the current $40 billion. Falling open interest is a sign of weak demand.
Demand for Bitcoin by Digital Asset Treasury (DAT) companies has waned recently, with Strategy being the only buyer recently. There is a risk that some companies will start selling their coins.
Bitcoin has remained under pressure as geopolitical risks rose, with Donald Trump warning that he may attack Iran any time soon. An attack would be bearish for Bitcoin as its role as a safe-haven asset has continued waning recently. Instead, investors have moved to other safe-haven assets like gold and the Swiss franc.
BTC/USD Technical Analysis
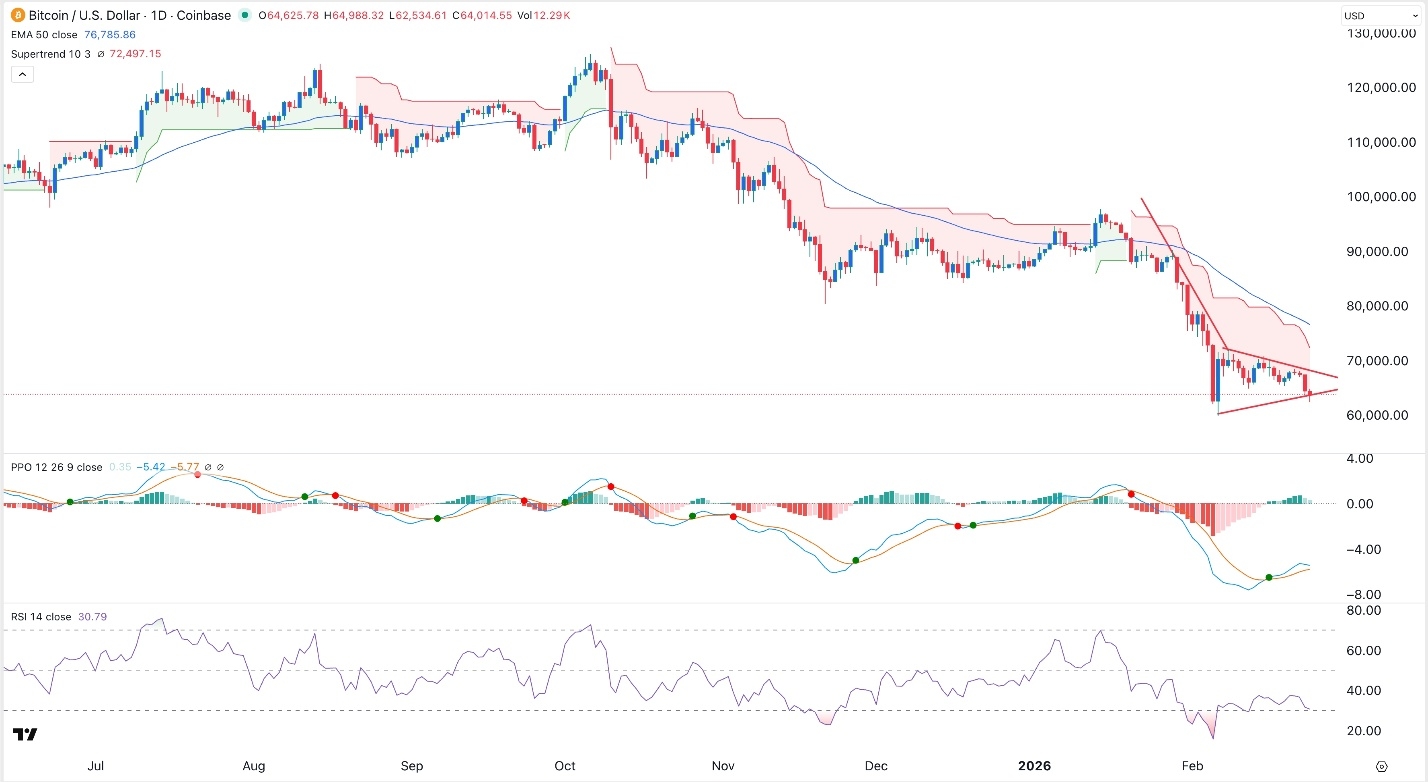
The daily timeframe chart shows that the BTC/USD pair has come under pressure in the past few months and is now hovering near its lowest level this year. It has remained below the 50-day Exponential Moving Average (EMA).
The pair also dropped below the Supertrend indicator, a sign that bears remain in the red. It has also moved below the Ichimoku cloud indicator.
Bitcoin price has formed a bearish pennant pattern, which is made up of a vertical line and a symmetrical triangle. It has also dropped below the important support level at 70,000.
Therefore, the most likely scenario is where the BTC/USD pair continues falling, potentially to the key support level at 60,000. A drop below that support will point to more downside to 50,000. On the flip side, a move above the resistance at 70,000 will invalidate the bearish outlook.