
Bearish view
- Sell the BTC/USD pair and set a take-profit at 60,000.
- Add a stop-loss at 71,000.
- Timeline:1-2 days.
Bullish view
- Buy the BTC/USD pair and set a take-profit at 71,000.
- Add a stop-loss at 60,000.
Bitcoin price continued its downtrend on Thursday as demand remained weak. The BTC/USD pair dropped to 66,370, continuing a downward trend that has been going on Sunday this week.
Top Regulated Brokers
Third-party data shows that Bitcoin’s demand has continued falling in the past few months. A good example of this is that Bitcoin treasury companies have largely paused buying in the past few months.
Similarly, data shows that the spot Bitcoin ETFs have continued shedding assets this month. They have shed over $8 billion in assets since October last year.
As a result, data shows that the Coinbase Premium Index has continued falling in the past few months, a sign of fading demand from the United States.
More data shows that the futures open interest has continued falling in the past few weeks, and currently stands at over $40 billion, down sharply from last year's high of $95 billion.
Falling open interest is a sign that leveraged demand from investors has continued falling in the past few months. This figure has continued falling in the past few months after the large liquidation event in October last year.
The BTC/USD pair retreated after the Federal Reserve minutes showed that officials were divided on interest rates. These minutes showed that there was no rush to cut rates, with some officials supporting a rate increase.
On the positive side, some officials have also supported more cuts this year. For example, Austan Goolsbee, a top Fed official, said that he supported more cuts this year if inflation continues falling.
BTC/USD Technical Analysis
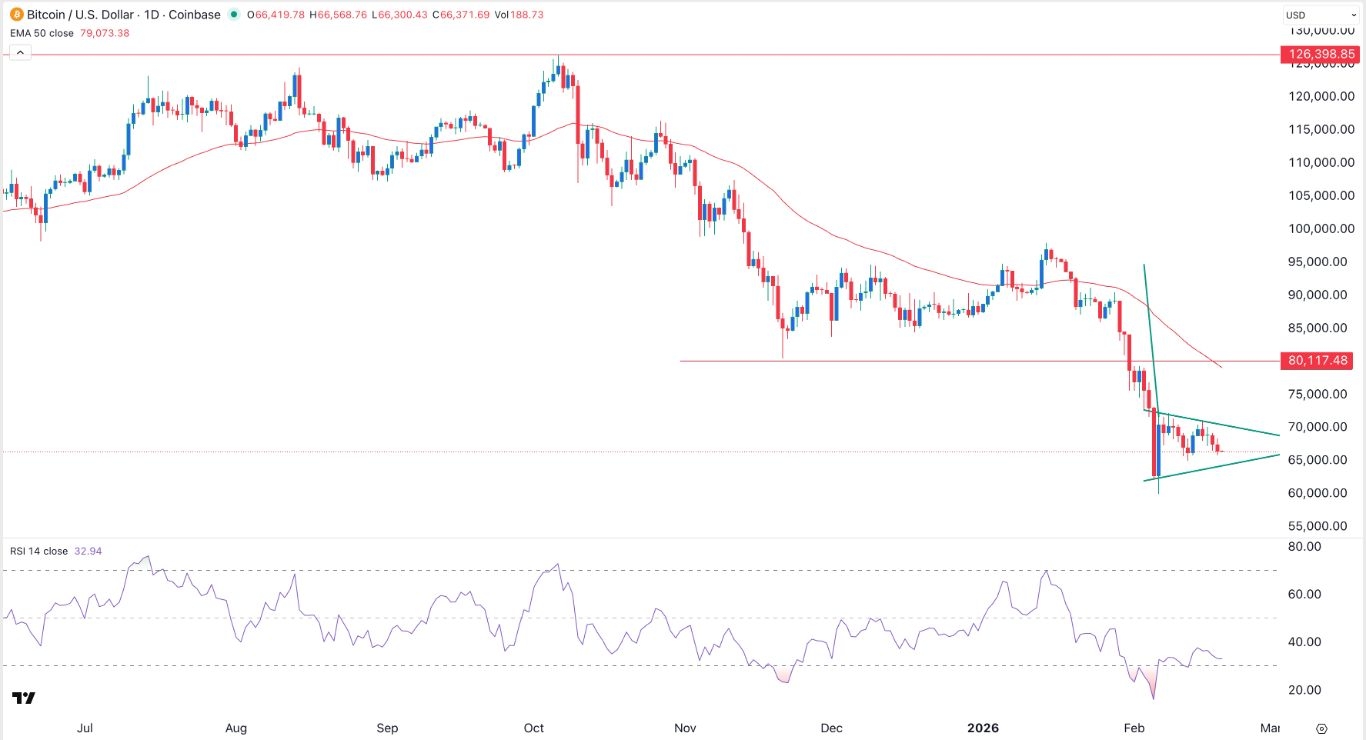
The daily timeframe chart shows that the BTC/USD pair has come under pressure in the past few days. It dropped to a low of 66,370, its lowest level since February 13.
The pair has slumped by over 47% from its highest level in October last year. It has also remained below the 50-day and 100-day Exponential Moving Averages (EMA).
Also, the pair has formed a bearish pennant pattern, which is made up of a vertical line and a symmetrical triangle pattern. The Relative Strength Index (RSI) has continued moving downwards to the current 32.
Therefore, the pair will likely continue falling as sellers target the next key support level at 60,000. A move below that level will raise the possibility of it moving to the psychological level at 50,000.