

The recent drop in Bitcoin comes against a backdrop of a confluence of macroeconomic pressures and market-specific dynamics, raising concerns that BTC price might extend its downtrend, possibly bottoming at $45,000.
Trump's 15% Global Tariff Announcement Suppresses BTC Price
On Saturday, Feb. 21, US President Donald Trump announced a 15% global tariff on imports, sending shockwaves through global markets, including cryptocurrencies. This announcement came after a ruling by the US Supreme Court that struck down his previous sweeping tariffs. The new levy—initially set at 10% was raised to 15%—takes effect today, Feb. 24, 2026.
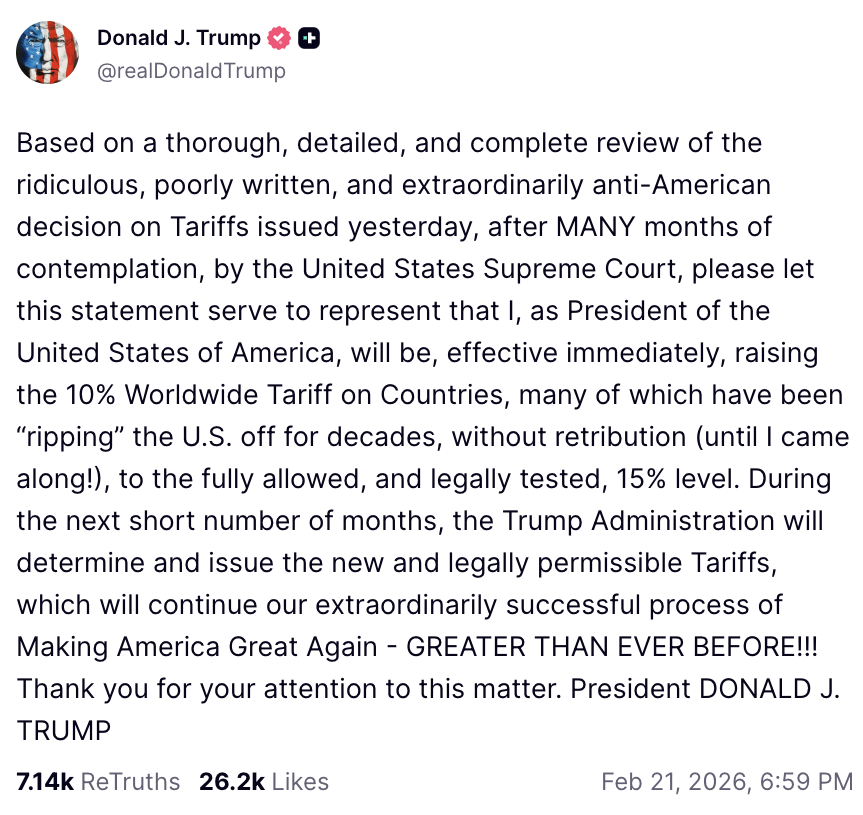
Source: Donald J. Trump on Truth Social
Invoked under Section 122 of the Trade Act of 1974, this tariff applies to most foreign goods for an initial 150 days, with potential extensions requiring congressional approval. While the move aims to address trade imbalances, it has amplified economic uncertainty, prompting a broad sell-off across risk assets.
In the crypto sphere, this announcement has exacerbated a risk-off sentiment, where investors flee volatile holdings in favor of stability. Bitcoin holders are selling at a loss, with on-chain data showing over $2.3 billion in realized losses in the past week alone.
“This is one of the largest capitulation events in BTC history, rivaling the 2021 crash, 2022 Luna/FTX collapse, and mid-2024 correction,” crypto analyst IT Tech said in a post on X, adding:
“This puts us in the top 3-5 loss events ever recorded. Only a handful of moments in Bitcoin's history have seen this level of capitulation.”
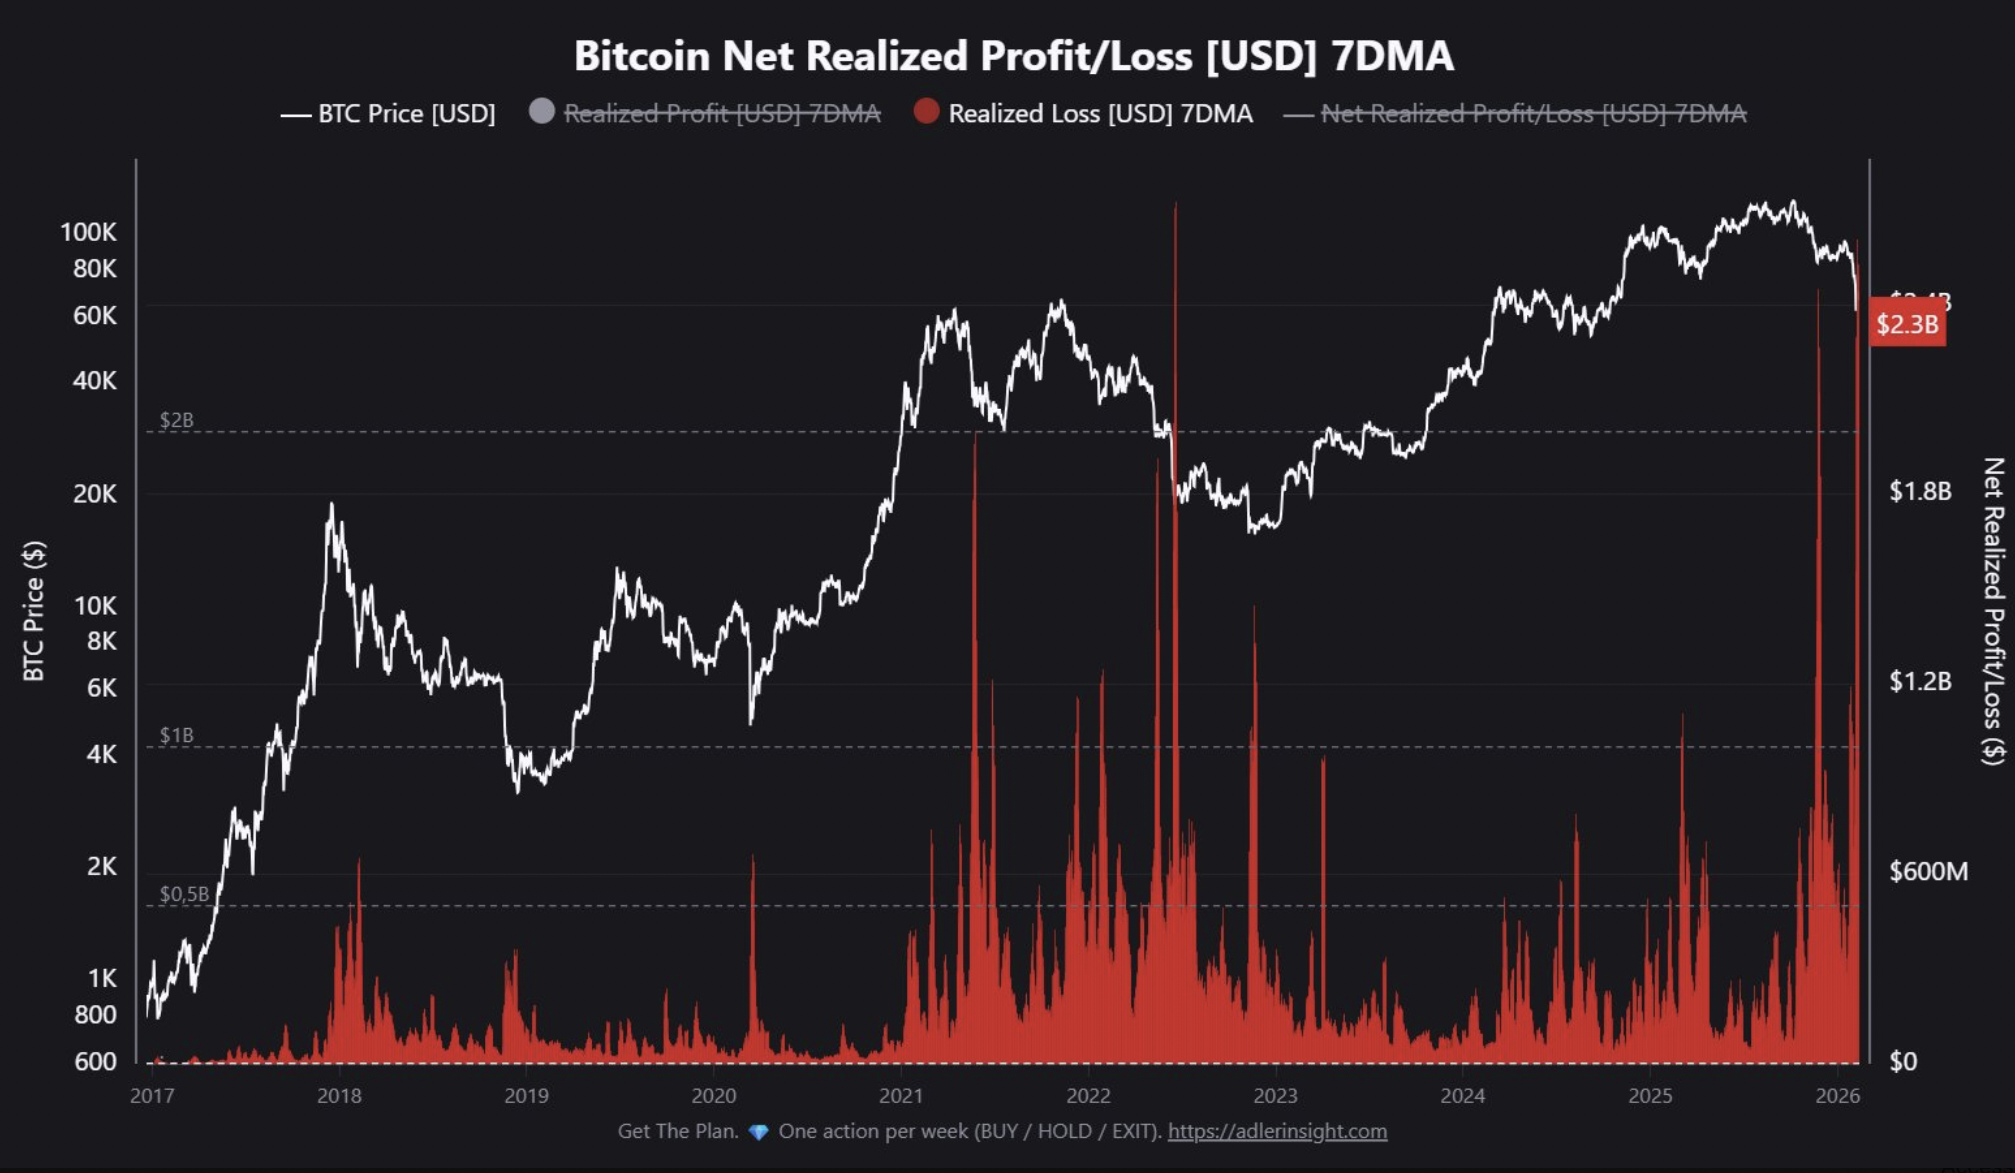
Bitcoin net realized profit and loss. Source: CryptoQuant
This behavior is driven by fears of inflation spikes from higher import costs, which could delay Federal Reserve rate cuts and tighten liquidity.
Markets plunged immediately after the announcement, with BTC dipping below $63,000 intraday.
Spot Bitcoin ETFs Have Posted a 5-week Outflow Streak
Compounding the tariff-induced turmoil are persistent outflows from U.S.-listed spot Bitcoin exchange-traded funds (ETFs), which have now bled capital for five straight weeks—the longest streak since February 2025.
According to data from SoSoValue, investors have withdrawn nearly $3.8 billion over this period, with last week alone seeing $316 million exit the funds.
BlackRock's iShares Bitcoin Trust (IBIT) led the exodus, shedding about $2.1 billion in the five-week loss streak, while Fidelity's FBTC and others followed suit. This reversal from the explosive inflows of late 2024 underscores a shift in institutional sentiment, as allocators reduce exposure amid broader market volatility.
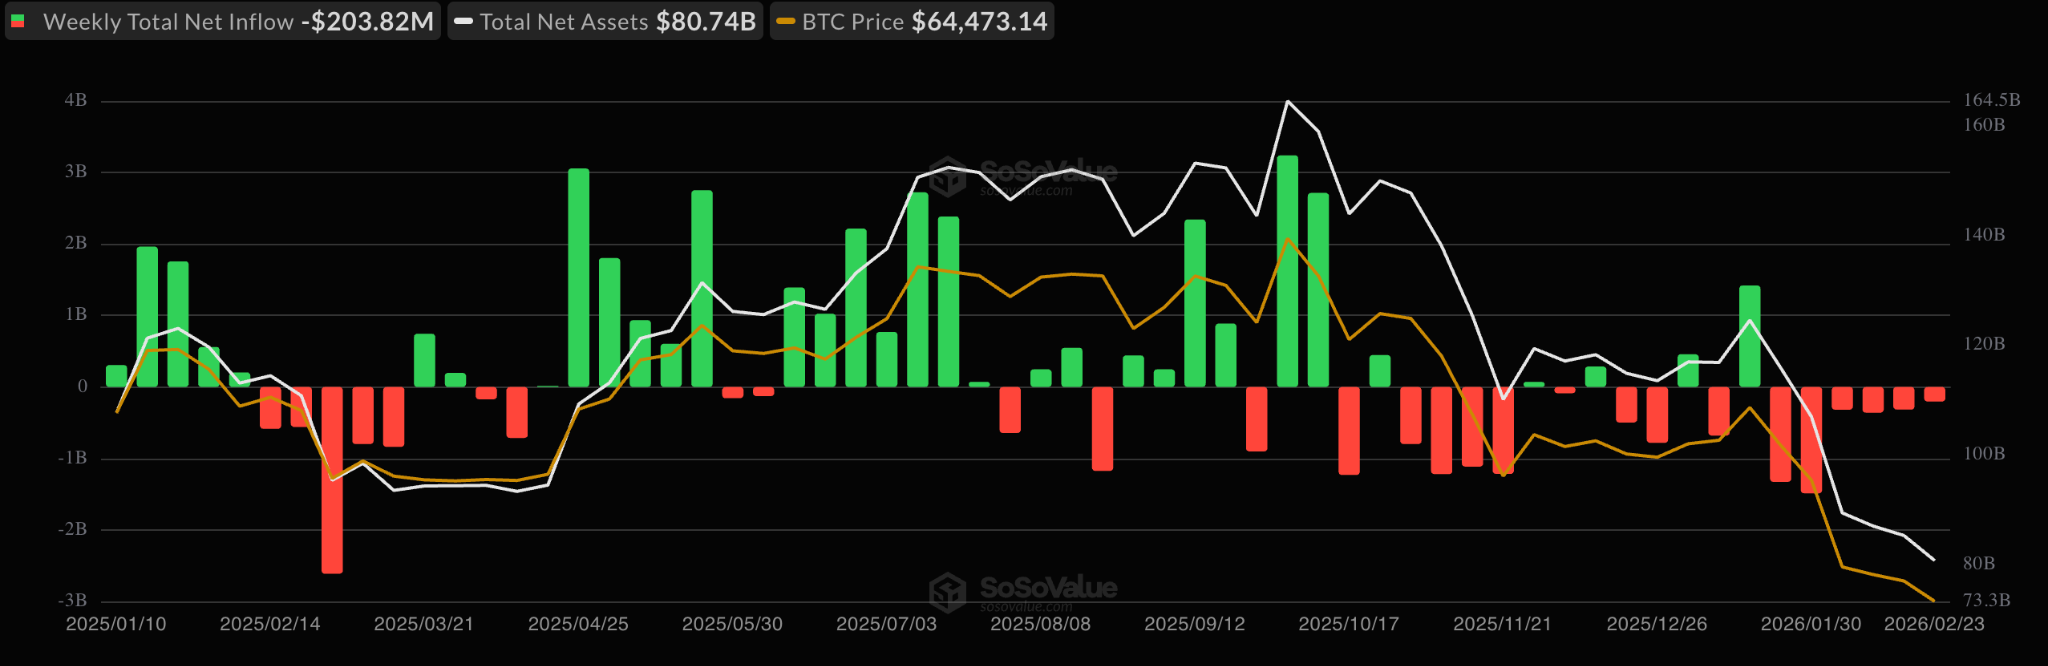
Spot Bitcoin ETF flows chart. Source: SoSoValue
These outflows add substantial sell-side pressure to BTC's price, as ETFs must liquidate underlying holdings to meet redemptions.
With cumulative outflows reaching $4.5 billion in 2026 so far, the complex has offset much of its earlier gains. Analysts attribute this to a "risk-off stress test," where macroeconomic headwinds like tariffs and geopolitical uncertainty deter fresh capital.
The Crypto Fear and Greed Index has plummeted to the most extreme fear levels in history, further fueling the cycle of sales.
Without a reversal in flows, the downward momentum could persist, pushing BTC lower as institutional selling dominates.
Bitcoin's Bear Pennant Targets $45K BTC Price
From a technical standpoint, Bitcoin’s price action paints a bearish picture, with a prominent bear pennant pattern emerging on the daily time frame.
This is a bearish continuation pattern, characterized by a sharp downward flagpole followed by a consolidating symmetrical triangle, typically resolving lower.
The BTC/USD pair broke below key support at $80,117, its November 2025 low, dropping as low as $60,000 on Feb. 6, forming the flag’s post. The price then recovered to $72,000 before retreating to the current price of $63,100.
The pennant was resolved when the price broke below its lower trend line at $67,000 on Monday. The measured target of the bear pennant, calculated by adding the flag’s height to the breakout points projecting BTC price drop to $45,000 to $50,000.
Such a move would represent a 28% drop from the current price.
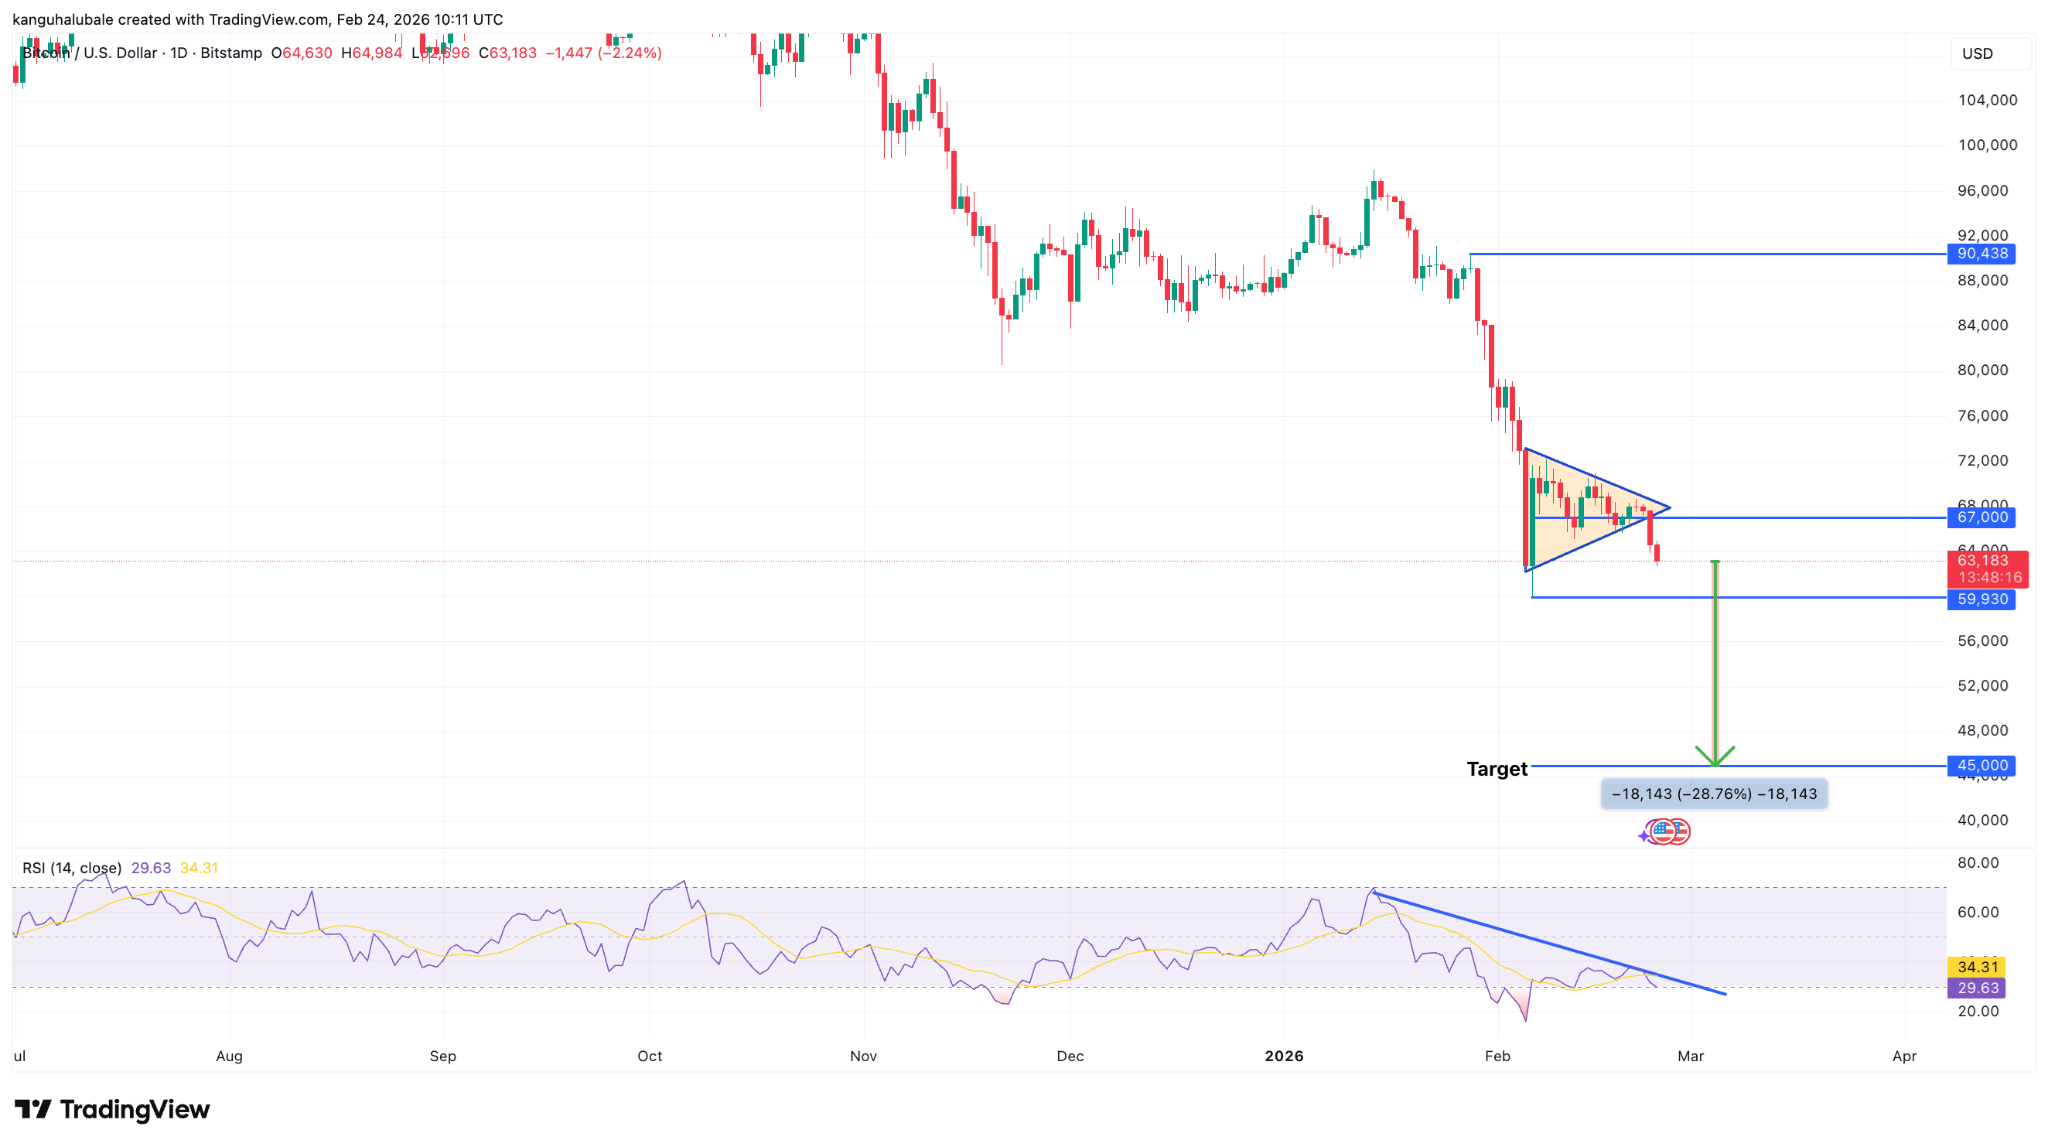
BTC/USD daily chart. Source: TradingView
This bearish thesis is supported by the increasing downward momentum, evidenced by the reduction of the RSI from 70 on Jan. 15 to the current level at 29.
The price remains below critical moving averages, and a breakdown below $60,000 could accelerate the move toward the $52,450 realized price level, a major support zone.
Conversely, a breakout above $72,700 would invalidate the pattern, potentially sparking a recovery.
Ready to trade our analysis of Bitcoin? Here’s our list of the best MT4 crypto brokers worth checking out.