
Walmart (WMT) stock signal, a fundamental snapshot, and a technical view on where its share price is heading. What to know before the market opens on January 6th, 2026, after WMT closed at $112.71 during the previous session, before advancing in after-market hours.
Short Trade Idea
Enter your short position between $112.25 (the intra-day high of its last bearish candlestick) and $115.51 (the mid-range of its horizontal resistance zone).
Market Index Analysis
Walmart (WMT) is a member of the Dow Jones Industrial Average, the S&P 100, and the S&P 500.
The Dow and S&P 500 rallied to start the trading week and remain near record highs despite ongoing economic concerns rooted in tariff uncertainty and consumer sector pressure, with selective buying in defensive consumer staples offsetting weakness in discretionary retail.
The Bull Bear Power Indicator of the S&P 500 turned bullish but remains below its descending trendline, signalling that while broad strength persists, weakness in pockets of the market—particularly consumer discretionary and tariff-sensitive names—undermines the reliability of the rally.
Market Sentiment Analysis
While Walmart has been a standout performer, advancing 25% in 2025 and benefiting from a flight-to-quality rally favoring large-cap, stable consumer staples, ongoing tariff uncertainty poses a structural headwind that markets may not yet have fully priced in. The Trump administration's recent postponement of certain tariff hikes on furniture and cabinetry has eased near-term sentiment, but fundamental tariff risk remains elevated with Supreme Court challenges pending on the legality of tariff authority—a binary event that could trigger volatility.
Walmart Fundamental Analysis
Walmart is one of the largest companies by revenue globally, the largest private employer, and the largest publicly traded family-owned company. It has over 10,000 stores operating under over 45 names in 24 countries.
So, why am I bearish on WMT after its breakdown?
Walmart's extreme valuation of P/E 39.71—a 35% premium to the S&P 500 average—leaves little room for earnings disappointment, yet tariff pressures and margin compression are nearly certain to arrive in coming quarters. Price target increases from analysts, while seemingly supportive, often fail to reflect the structural damage tariff costs inflict on a retailer's gross margins, particularly one as dependent on imports as Walmart.
Ongoing tariff uncertainty continues to hang over the company's near-term outlook. Rising input costs from suppliers seeking to offset their own tariff exposure will gradually flow into Walmart's balance sheet, compressing the very margins that have driven the stock's outperformance.
The decrease in self-checkout lanes in response to theft and consumer backlash against self-checkout fees signals operational challenges and deteriorating store-level execution, contrary to the narrative of operational excellence embedded in current price targets.
At current valuations, Walmart offers limited upside and expanding downside risk, particularly if tariff escalation or margin miss surprises the market and triggers a reassessment of the stock's premium rating.
Metric Value | Verdict | |
|---|---|---|
P/E Ratio | 39.71 | Bearish |
P/B Ratio | 9.35 | Bearish |
PEG Ratio | 4.10 | Bearish |
Current Ratio | 0.80 | Bearish |
ROIC-WACC Ratio | Positive | Bullish |
Walmart Fundamental Analysis Snapshot
The price-to-earnings (P/E) ratio of 39.71 makes WMT an expensive stock. By comparison, the P/E ratio for the S&P 500 overall is 29.32.
The average analyst price target for WMT is $121.38. This suggests limited upside potential with rising downside risks.
Walmart Technical Analysis
Today's WMT Signal
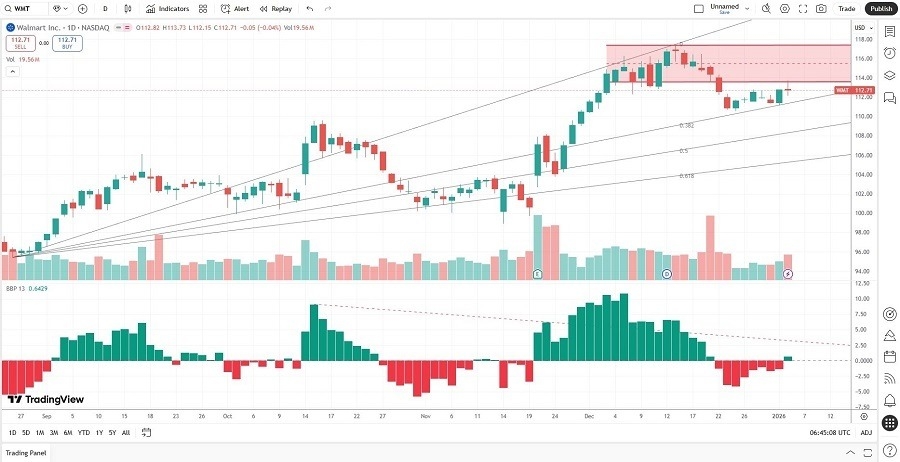
The WMT D1 chart shows price action breaking down from a prior resistance zone near $115.00–$116.50, failing to establish new highs despite multiple retest attempts, a bearish continuation pattern that signals weakening buying conviction.
WMT trades below its 50-day moving average while the 20-day average remains compressed sideways, with price action oscillating between the $112.00 support and $115.50 resistance, indicating an indecisive period of distribution and accumulation ahead of the January earnings season is probably taking place.
The Bull Bear Power Indicator on the WMT daily chart has rolled over from positive to neutral, with the indicator failing to confirm the stock's recent price strength, a classic bearish divergence which can precede a sharper downside move.
Average trading volumes on recent rally attempts are below the 20-day average, suggesting weak institutional demand, while any breakouts are met with selling on the first spike, a pattern consistent with profit-taking and tactical lightening of long positions.
WMT has begun to underperform the broader Dow Jones Industrial Average and S&P 500 on a relative strength basis, a deteriorating technical signal that undermines the bullish narrative embedded in analyst price-target increases and suggests the stock may be vulnerable to a sharper pullback.
My WMT Short Stock Levels and R/R
WMT Entry Level: Between $112.25 and $115.51
WMT Take Profit: Between $91.89 and $93.43
WMT Stop Loss: Between $121.38 and $123.81
Risk/Reward Ratio: 2.23
Ready to trade our analysis of Walmart? Here is our list of the best stock brokers worth reviewing.