
Short Trade Idea
Enter your short position between $444.57 (yesterday's intra-day low) and $457.55 (yesterday's intra-day high).
Market Index Analysis
- Tesla (TSLA) is a member of the NASDAQ 100, the S&P 100, and the S&P 500.
- The NASDAQ 100 Index rallied to start the trading week and remains within touching distance of recent highs, though technical momentum indicators show signs of fatigue with bearish divergence in the RSI and extreme overbought conditions in the Stochastic Oscillator, suggesting a pullback may be overdue.
- The Bull Bear Power Indicator of the NASDAQ 100 turned bullish but remains vulnerable given the compressed technical setup, rising valuations, and widening spread between index leaders (mega-cap AI names) and struggling contributors like Tesla.
Market Sentiment Analysis
Despite a constructive start to 2026 driven by geopolitical developments and reduced safe-haven demand, Tesla faces a sharp reversal in investor sentiment following the disclosure that it ceded its EV crown to China's BYD for the first time on an annual basis. Tesla delivered only 1.64 million vehicles in 2025, down from 1.79 million in 2024, marking a second consecutive year of declining deliveries and contradicting the company's growth narrative.
Earnings sentiment ahead of the Wednesday, January 8th earnings release is cautious at best, with analysts warning of a potential miss and further margin compression from intense price competition in North America and Europe, as well as the loss of US EV tax credits that expired in September 2025. The NASDAQ 100's overbought technicals combined with Tesla's disappointing delivery figures suggest that the broader index rally may have overextended, with technology and EV stocks becoming vulnerable to profit-taking.
Tesla Fundamental Analysis
Tesla is one of the world's most valuable companies by market capitalization, but it faces stiff competition from Chinese rivals, particularly BYD, which has now overtaken it as the world's leading EV maker. Expiring EV credits, rising competitive pressures, and brand damage from CEO political rhetoric have combined to erode demand and market share. The company's pivot toward robotaxi and autonomous vehicle development remains speculative and highly valuation dependent.
So, why am I bearish on TSLA ahead of its earnings?
Tesla's extreme valuations leave no room for disappointment, yet the company is almost certain to disappoint when it reports earnings on Wednesday, January 8th. The P/E ratio of 313.66 assumes near-perfect execution and explosive earnings growth that is increasingly divorced from fundamental reality, particularly given that the company posted its second consecutive annual delivery decline in 2025.
Declining profit margins are structural, not cyclical. As BYD continues to scale production globally and European competitors intensify their EV rollouts, Tesla has been forced to cut prices repeatedly, compressing unit economics and cash generation. The loss of US EV tax credits that previously supported demand has exposed weakness in underlying buyer interest, while stiff competition from China—particularly BYD's 28% global EV sales growth in 2025—has permanently reshaped the competitive landscape.
An $80 price target floated by some analysts now appears more realistic than the consensus $399.53, particularly if the Wednesday earnings call reveals further margin deterioration, a lower forward delivery outlook, or delayed robotaxi monetization. Combined with the NASDAQ 100's overbought technical setup and Tesla's widening underperformance relative to the index, a sharp drop is likely if the stock fails to confirm its recent price action with a positive earnings surprise.
Metric | Value | Verdict |
|---|---|---|
P/E Ratio | 313.66 | Bearish |
P/B Ratio | 18.22 | Bearish |
PEG Ratio | 8.75 | Bearish |
Current Ratio | 2.07 | Bullish |
ROIC-WACC Ratio | Positive | Bullish |
Tesla Fundamental Analysis Snapshot
The price-to-earnings (P/E) ratio of 313.66 makes TSLA an expensive stock. By comparison, the P/E ratio for the NASDAQ 100 is 34.14.
The average analyst price target for TSLA is $399.53, suggesting no upside potential with increasing downside risks.
Tesla Technical Analysis
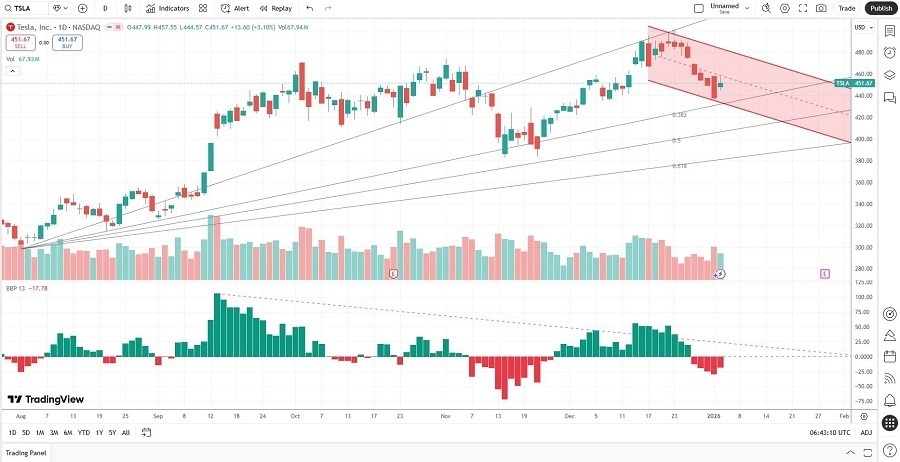
Today's TSLA Signal
- The TSLA D1 chart shows price action breaking down from an intermediate consolidation zone after failing to sustain gains above the $460.00 level, signalling that buyers lack conviction ahead of the critical Wednesday earnings report.
- TSLA trades below its 50-day moving average and is being compressed between descending trendlines, with price action now printing lower highs, a bearish setup that suggests further downside toward the $440.00–$430.00 support band if the index rolls over.
- The Bull Bear Power Indicator on the TSLA daily chart has rolled over to a neutral-to-bearish reading, with the indicator failing to confirm the recent price strength, a classic bearish divergence that often precedes sharper declines.
- Average trading volumes on TSLA are elevated but skewed toward distribution (selling), with large blocks being liquidated into any intraday strength, a pattern consistent with institutional lightening ahead of earnings surprises or guidance cuts.
- TSLA has begun to materially underperform the broader NASDAQ 100 Index on a relative strength basis, now near multi-week lows relative to the index, a decisive bearish sign that suggests sector rotation away from mega-cap growth and toward value, cyclicals, and defence names.
My TSLA Short Stock Levels and R/R
- TSLA Entry Level: Between $444.57 and $457.55.
- TSLA Take Profit: Between $297.82 and $314.60.
- TSLA Stop Loss: Between $481.77 and $498.83.
- Risk/Reward Ratio: 3.95
Ready to trade our analysis of Tesla? Here is our list of the best stock brokers worth reviewing.