
The Nasdaq 100 has gone back and forth again during the month of January continuing the sideways action that we had seen in both November and December. Ultimately, I think this is a market that is trying to do everything they can to break above the 26,000 level.
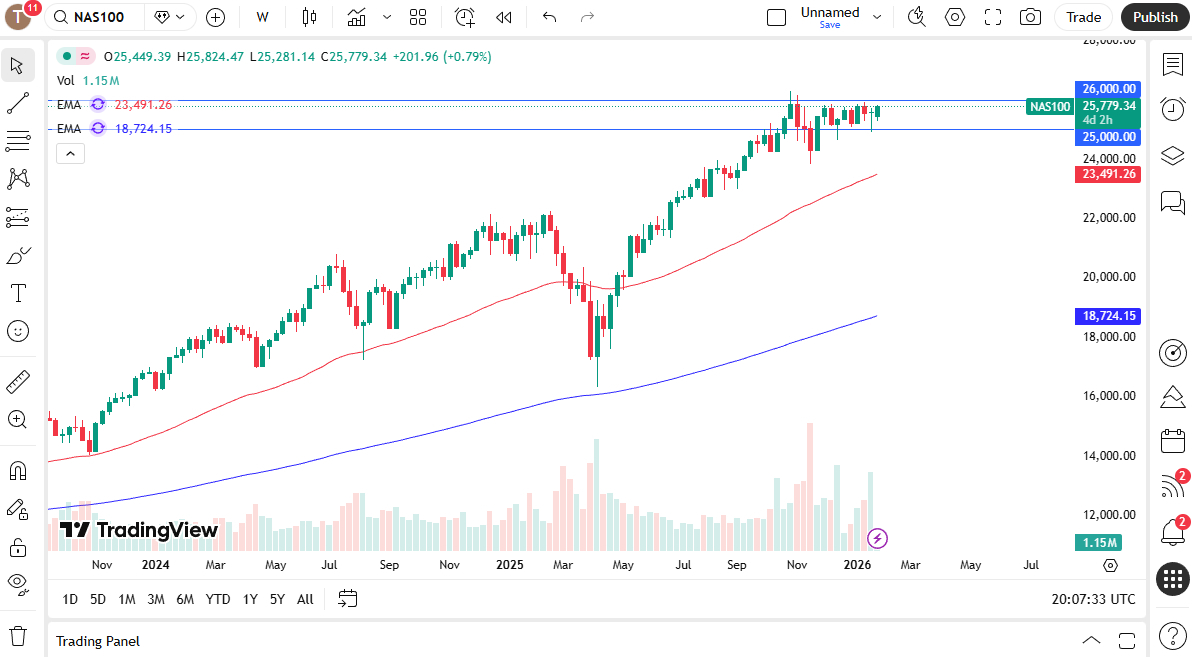
Breaking above the 26,000 level is a bullish sign and I do think a lot of people would probably get a little bit of FOMO above there. When we get above there and close on a weekly candlestick, I think you have a situation where people will be looking to buy the Nasdaq 100 and not only on momentous breakouts but also on short-term pullbacks that show a small bounce.
Support Levels and Bullish Outlook
The 25,000 level has been supported extending all the way down to the 24,250 level. There will be quite a few earnings calls heading into February that could have a major influence here but when you look at the longer-term chart it's pretty obvious that we have been bullish until the last few months. This is a market that has simply hanging about, but also hasn`t been able to break down significantly.
The last few months have been more or less about working off some of the excess froth and it certainly looks that every time we sell this market off there are plenty of buyers willing to come in so this tells me that sooner or later the Nasdaq 100 will find a reason to rally from here.
If and when we do break above the 26,000 level, then I think you've got a situation where we could eventually go looking to the 27,500 level. This is a market that will remain very noisy and of course driven by the idea of artificial intelligence and many other factors but the Nasdaq 100 as per usual will lead stock markets in the United States higher over the longer term. This is the norm in this environment.
Ready to trade the daily stock analysis? Here are the best CFD brokers to choose from.