
A dismal average return on invested capital, sub-standard annual revenue gains, and insider selling raise red flags. What’s next after a double breakdown in Global Life?
Short Trade Idea
Enter your short position between $140.58 (the lower band of its horizontal resistance zone) and $144.44 (the upper band of its horizontal resistance zone).
Market Index Analysis
- Globe Life (GL) is a member of the S&P 500.
- This index trades inside a bearish chart pattern with decreasing bullish trading volumes.
- The Bull Bear Power Indicator of the S&P 500 shows a negative divergence and does not support the uptrend.
Market Sentiment Analysis
The Santa Claus rally stumbled out of the gate to start the last trading week of 2025, led lower by NVIDIA and Tesla. Adding to intra-day volatility was erratic trading in silver, which surged to an all-time high above $80 before dropping by over 5%. Pending home sales posted their biggest gain since 2023, but mortgage rates remain elevated. Today’s FOMC meeting could set the tone for the rest of the week, amid a vacuum of market-moving data. Futures are moving lower this morning, while excessive bullish sentiment for 2026 is a rising concern.
Globe Life Fundamental Analysis
Globe Life is a financial services holding company. Its subsidiaries, Globe Life Liberty National Division, Globe Life and Accident Insurance Company, United American Insurance Company, American Income Life Insurance Company, and Globe Life Family Heritage Division, provide life insurance, annuities, and supplemental health insurance products.
So, why am I bearish on GL after its recent 13%+ uptrend?
Globe Life lags its peers in annualized revenue and net premium growth, while its average return on invested capital ranks among the industry’s worst. I am also bearish about its policy losses and capital returns, which have eroded its book value per share by an average of 2% annualized over the past five years. The share sales by its CEO and Co-Chairman add to the uncertainty.
Metric | Value | Verdict |
P/E Ratio | 10.29 | Bullish |
P/B Ratio | 1.98 | Bullish |
PEG Ratio | Unavailable | Bearish |
Current Ratio | 0.62 | Bearish |
ROIC-WACC Ratio | Negative | Bearish |
Globe Life Fundamental Analysis Snapshot
The price-to-earnings (P/E) ratio of 10.29 makes GL an inexpensive stock. By comparison, the P/E ratio for the S&P 500 is 29.47.
The average analyst price target for GL is $168.30. It suggests moderate upside potential with expanding downside risks.
Globe Life Technical Analysis
Today’s GL Signal
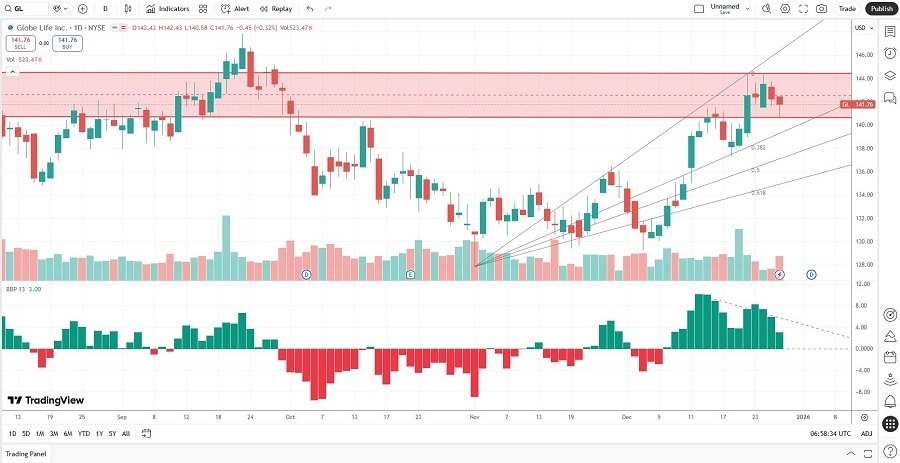
Globe Life Price Chart
- The GL D1 chart shows price action inside a horizontal resistance zone.
- It also shows price action between its ascending 0.0% and 38.2% Fibonacci Retracement Fan levels.
- The Bull Bear Power Indicator is bullish with a negative divergence.
- The average bearish trading volumes are rising.
- GL mirrored the S&P 500, a bullish confirmation, but breakdown indicators have increased.
My Call on Globe Life
I am taking a short position in GL between $140.58 and $144.44. Global Life trails its peers across the board, and despite low valuations, I see no catalysts for upside, but plenty of breakdown indicators.
- GL Entry Level: Between $140.58 and $144.44
- GL Take Profit: Between $125.19 and $127.85
- GL Stop Loss: Between $147.83 and $150.79
- Risk/Reward Ratio: 2.12
Top Regulated Brokers
Ready to trade our analysis of Globe Life? Here is our list of the best stock brokers worth checking out.