
Third-quarter earnings beat across the board, and NVIDIA raised its outlook, but high valuations and crucial questions surrounding its core customers remain. What will followearnings?
Short Trade Idea
Enter your short position between 187.86 (yesterday’s intra-day high) and 195.62 (the intra-day high of the left shoulder of its potential head-and-shoulders pattern).
Market Index Analysis
- NVIDIA (NVDA) is a member of the NASDAQ 100, the Dow Jones Industrial Average, the S&P 100, and the S&P 500
- All four indices are in a bearish chart pattern, with rising downside pressure.
- The Bull Bear Power Indicator for the NASDAQ 100 is bearish with a descending trendline, and does not confirm the uptrend
Market Sentiment Analysis
Equity markets finished yesterday’s session higher, and equity futures are surging on the back of NVIDIA’s earnings reports and guidance. It suggests the AI trend is strong, and all eyes are on September’s delayed NFP report, expected to show modest job gains. Minutes from the Federal Reserve’s last meeting highlighted different views on future monetary policy. Walmart will report earnings before the bell, offering more data on consumer health following mixed reports from other retailers.
NVIDIA Fundamental Analysis
NVIDIA is a semiconductor company that emerged as the leading AI company. Originally catering to gamers with high-end GPUs, it broadened into AI, and its tremendous success made it the first company to reach a $5 trillion market cap.
So, why am I bearish on NVDA despite its superb earnings report?
Third-quarter revenues of $57.01 billion and earnings per share of $1.30 beat estimates of $54.92 and $1.25, respectively. NVIDIA also raised its fourth-quarter revenue outlook to $65.00 billion, above expectations of $61.66 billion. I remain bearish, as I believe the current share price reflects the good news, and today’s price spike will not change the narrative. Chinese competitors, led by Huawei, outperform NVDA at lower costs. I am also wary about future spending by its core US customers.
NVIDIA Fundamental Analysis Snapshot
Metric | Value | Verdict |
P/E Ratio | 46.05 | Bearish |
P/B Ratio | 44.10 | Bearish |
PEG Ratio | 0.78 | Bullish |
Current Ratio | 4.21 | Bullish |
ROIC-WACC Ratio | Positive | Bullish |
The price-to-earnings (P/E) ratio of 46.05 makes NVDA an expensive stock. By comparison, the P/E ratio for the NASDAQ 100 is 35.82.
The average analyst price target for NVDA is 234.96. It suggests good upside potential, but downside risks have risen.
NVIDIA Technical Analysis
Today’s NVDA Signal
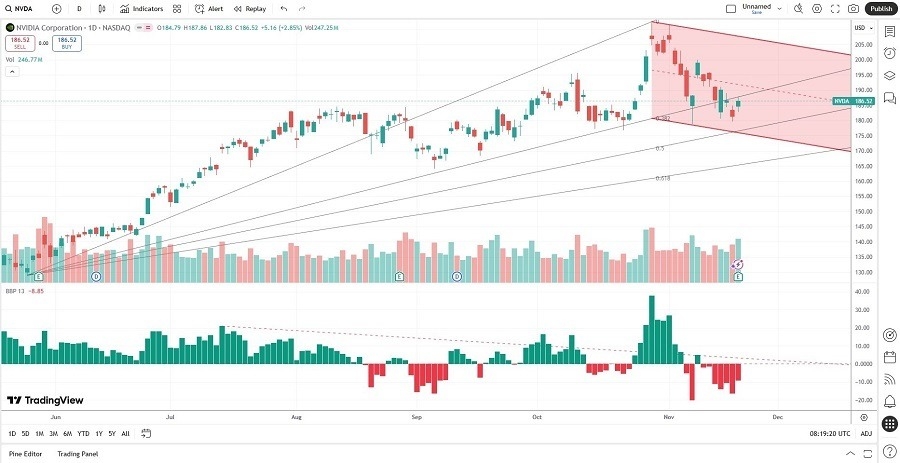
- The NVDA D1 chart shows price action inside a bearish price channel
- It also shows price action trading between its ascending 38.2% and 50.0% Fibonacci Retracement Fan
- The Bull Bear Power Indicator is bearish with a negative divergence
- The average bearish trading volumes are higher than the average bullish trading volumes since its retreat
- NVDA led the correction in the NASDAQ 100, a bearish confirmation
My Call
I am taking a short position in NVDA between 187.86 and 195.62. I appreciate its long-term potential as a core AI player, but lofty valuations, competition from China, high-profile exits, and questions surrounding its core US customer base raise concerns.
- NVDA Entry Level: Between 187.86 and 195.62
- NVDA Take Profit: Between 132.92 and 146.18
- NVDA Stop Loss: Between 212.19 and 223.58
- Risk/Reward Ratio: 2.26
Ready to trade our analysis of NVIDIA? Here is our list of the best stock brokers worth checking out.