
- Meta gapped lower to kick off the trading session on Monday, as we threatened to test the $685 level. The $685 level is, of course, an area that’s been important multiple times, and now it’s starting to attract the 200 Day EMA indicator.
- The 200 Day EMA typically will determine the longer-term trend. I think you have a situation where traders are likely to turn around and are going to continue to see plenty of value in this region, as we try to continue the overall uptrend.
Support
If we were to break down below support, we could see the market for Meta really unravel, perhaps reaching down to the $600 level. The $600 level of course has a major amount of psychological importance attached to it, and I do think that there will be a lot of psychology that comes into play, and of course, headlines perhaps to keep the market upload if we in fact did break down below there. All that being said, we would have to break down below the $685 level to consider those fears, but I think at this point in time, it’s likely that Meta will continue to be one of the favorites out there, because the herd is still buying artificial intelligence stocks.
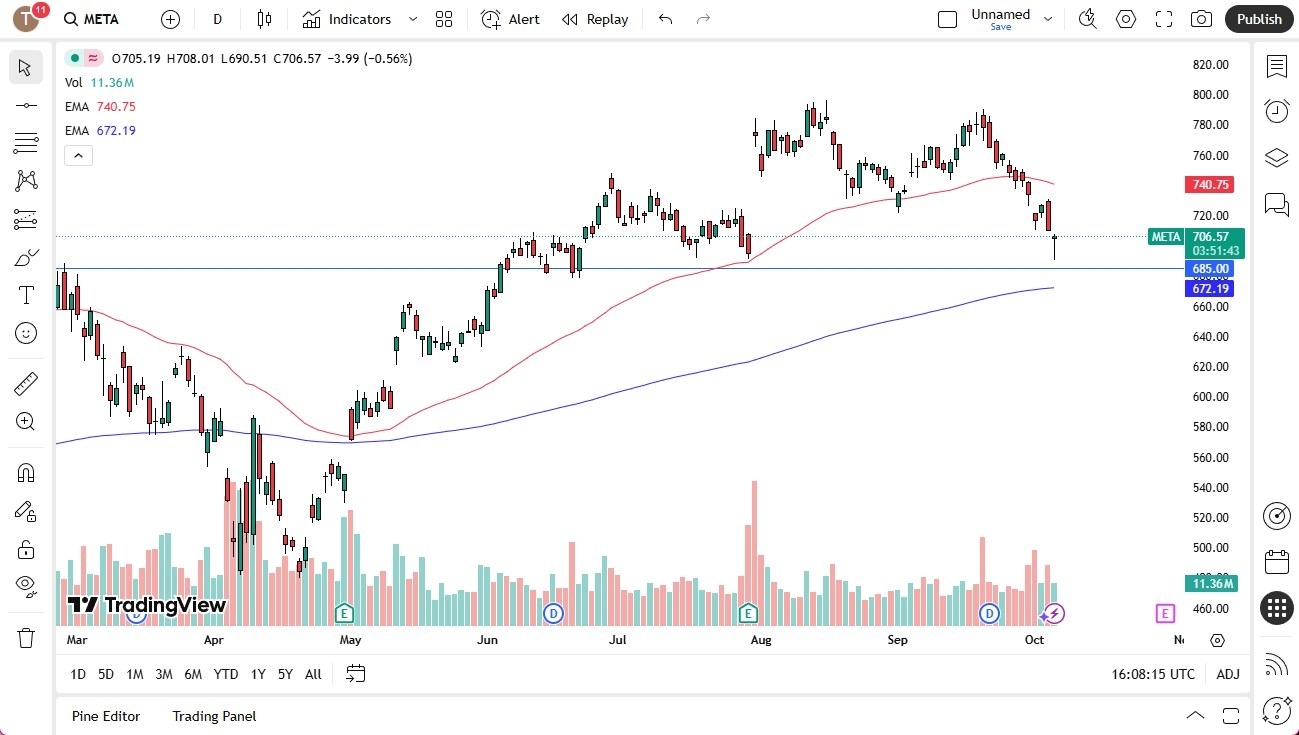
To the upside, we could see this market break to the $800 level again, an area that’s been important multiple times. If we break above the $800 level, then the market could really start screaming higher at that point, as it would kick off the next leg to the upside. I think all things being equal, this is a market that will continue to lead the way going forward, and the balance that we have seen on Monday is a strong sign for a lot of tech stocks.
While I do think it’s a bit of a stretch to call Meta technology at this point, I also recognize that the market tends to look at this right along with the other AI stocks, so therefore it becomes a bit of a group mentality type of scenario.
Top Regulated Brokers