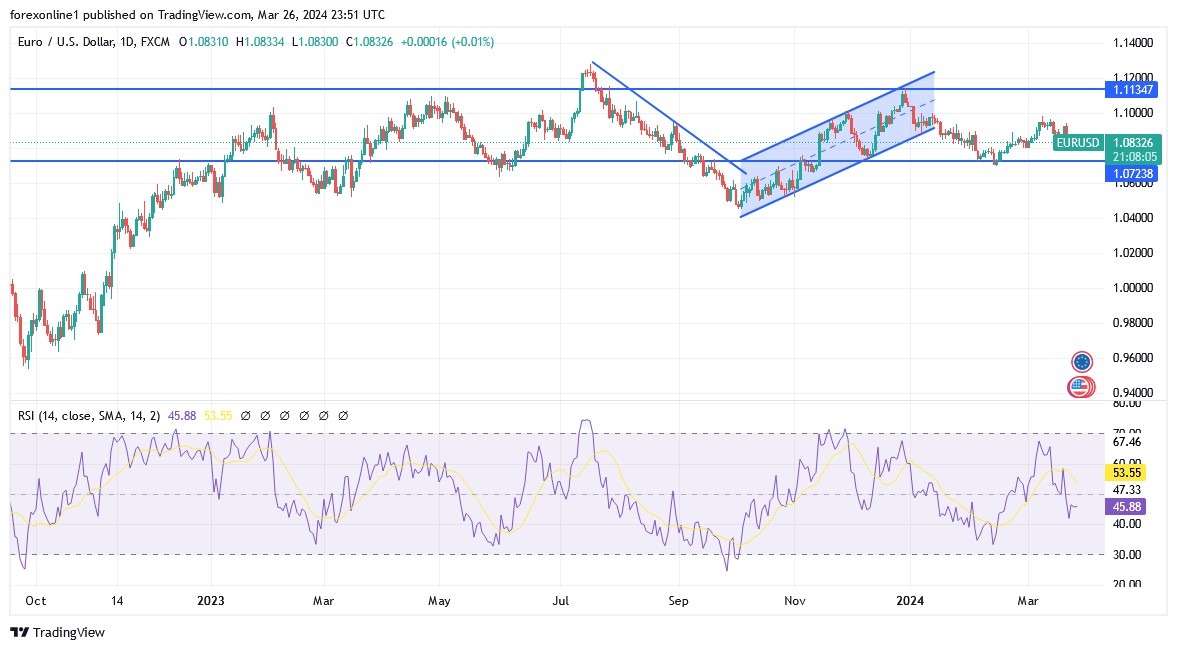
- Amid a holiday-dominated trading week with only the Fed's favorite inflation reading to watch, the EUR/USD currency pair is moving in tight ranges with a bearish bias, stabilizing around the 1.0850 support level.
- As can be seen, the euro is trying to stay away from the 1.0800 psychological support level to avoid further collapse.

Will the price of the Euro rise in the coming days?
The EUR/USD exchange rate will be in focus as traders wonder whether last Friday's break below the 200-day moving average was a temporary move or one with legs. According to forex trading platforms, the euro bounced against the dollar after breaking below the 200-day moving average (1.0835) on Friday. Let's see if it can reclaim the 200-day again. If so, the outcome will be bullish. If so, what bulls need to see for confirmation is a break above the downtrend line, which is around the 1.0925-1.0950 area. On the downside, 1.0795 is now the key level to watch. This was the other low formed late last month.
Ideally, bulls wouldn't want to see the price go back below this level now. However, a clear break below this level could pave the way for a larger decline towards 1.0700.
Last week, the US dollar rose, even though the Fed was dovish as the FOMC maintained its forecast of three US rate cuts this year. Clearly, part of its support comes from increasingly hawkish external factors, including the surprise rate cut by the Swiss National Bank, as well as the accommodative stances of the Bank of England and the Reserve Bank of Australia. Declines in the pound, franc, euro, and Australian dollar have all contributed to the recent rise in the US dollar, alongside encouraging US economic indicators such as PMIs, existing home sales and jobless claims. However, these headline releases are unlikely to deter the Fed from considering a US rate cut in June, especially amid falling inflation.
Top Regulated Brokers
After the PCE inflation data this week, attention will turn to the US non-farm payrolls report and CPI data in the coming weeks. Obviously, US economic data for March due in early April will have a major impact on the direction of the US dollar. Weakness in these figures, especially the upcoming inflation data, could potentially trigger a sustained decline in the value of the dollar.
EUR/USD Technical analysis and forecast:
The price of the EUR/USD pair formed higher lows connected to the downtrend line, which remained intact throughout the month. This is indicating another test of resistance is pending. The Fibonacci correction tool shows additional levels that sellers may enter. Also, the 38.2% Fibonacci level is near 1.0857, close to the dynamic resistance of the 100 SMA. A larger correction may reach the 50% Fibonacci level near the dynamic pivot point of the 200-period simple moving average at 1.0873. Moreover, the nearest 61.8% Fibonacci level is near the trendline at 1.0890 and the key psychological mark at 1.0900, which could be the neutral and decisive level for the downward retracement.
At the same time, the 100 SMA is below the 200 SMA to confirm that the overall trend is still bearish, or that selling pressure is likely to gain momentum rather than reverse. Also, the stochastic indicator is heading downwards from the overbought zone, indicating sellers are in control while buyers take a break. Additionally, the Relative Strength Index seems to peak without reaching the overbought zone, indicating that bears are eager to control. Ultimately, both oscillation indicators have ample room for decline before reflecting exhaustion among sellers, so the EUR/USD may continue following the same approach.
Ready to trade our daily Forex forecast? Here’s a list of some of the best online forex trading platforms to check out.
