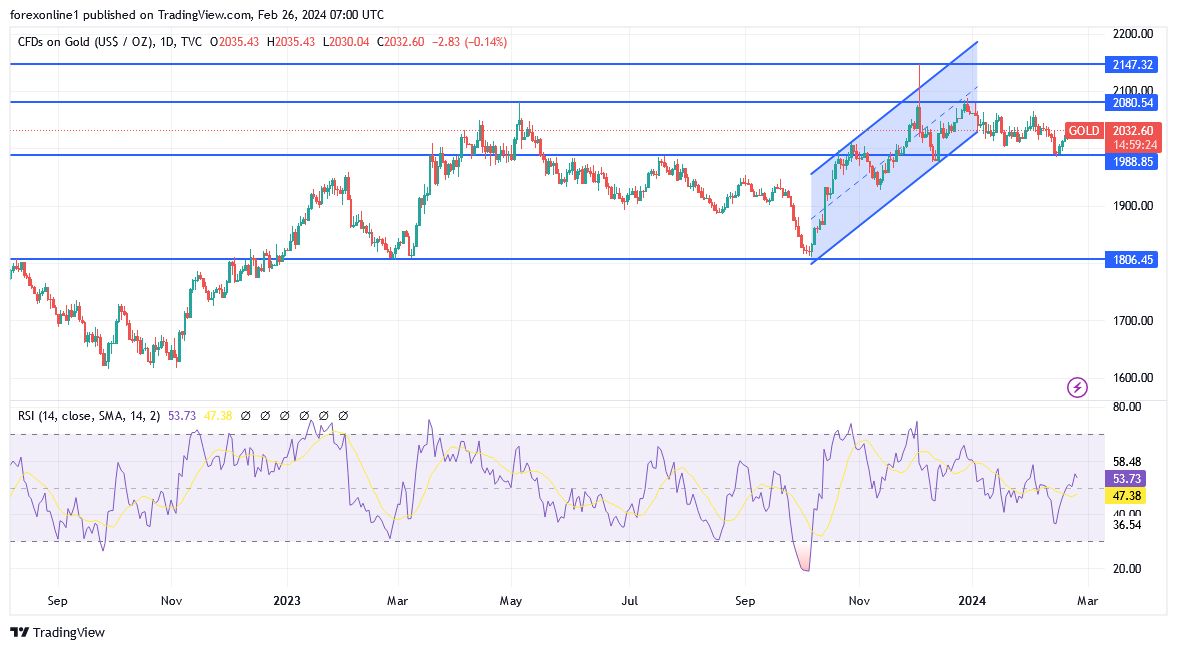
- Gold prices started this week's trading stable around the $2036 resistance level, which was approximately the closing level of last week.
- By the end of last week's trading, the gold price jumped towards the $2041 resistance level.
- Thus, the price of gold continues to achieve gains despite the strength of the US dollar, supported by the positive results of the US economic sectors, despite the continued tightening of the US Central Bank’s policy.

According to fundamental analysis, gold trading is influenced by the results of recent economic data. The performance of the preliminary global manufacturing PMI from the US S&P for February exceeded expectations of 50.5 with a reading of 51.5. The Services PMI for this period missed expectations at 52 with a reading of 51.5. On the other hand, initial US unemployment claims for the week ending February 16 exceeded estimates of 218,000, with a much lower total of 201,000. Continuing claims for the week ending February 9 also exceeded estimates of 1.885 million for a total of 1.862 million.
This week, core inflation in the United States likely rose in January by the most in a year, as tracked by the US Federal Reserve's preferred measure, highlighting the long and bumpy path to taming price pressures. Accordingly, the core personal consumption expenditures price index, which excludes food and energy costs, is expected to rise by 0.4% from the previous month. Therefore, this would mark the second straight monthly acceleration in a gauge that has been declining significantly over the past two years.
Top Regulated Brokers
Moreover, by breaking down the data into a three- or six-month basis, each will rebound above 2% after falling below the Fed's target in December. US central bank officials stressed that they are not in a rush to reduce borrowing costs and will only do so when they become confident that inflation is declining on a sustainable basis. Personal consumption expenditures data, scheduled for release next Thursday, are likely to confirm this position and perhaps reduce market expectations of interest rate cuts in the coming months.
Elsewhere this week, crucial inflation reports from the Eurozone, Japan and Australia will also keep investors interested, while G20 finance ministers and central bank governors are scheduled to meet in Sao Paulo from Wednesday. Also, the central banks of Australia and Japan will receive new inflation data that may stimulate or reduce pivotal policy bets in different directions. The Australian CPI is expected to rise by up to 3.5% year-on-year for January, a pace that will still be slow enough to sustain speculation about a rate cut by the Australian central bank.
On the other hand, the consumer price inflation rate in January in Japan, excluding fresh food items, may slow to 1.8%, falling below the Bank of Japan’s 2% target for the first time since March 2022, but do not be fooled. Therefore, it is Base effects are expected to lead to a rebound in February, maintaining inflation. The bank is on track to end negative interest rates within a month or two.
Gold Price Forecast and Analysis Today:
Based on the performance on the daily chart above, and after the recent gains in the price of gold, the direction of technical indicators has turned upwards. In the event that the gains of the US dollar cease, coupled with increasing global geopolitical tensions, gold prices may find an opportunity to move towards higher resistance levels, the most important of which currently are $2055 and $2070 per ounce. Moreover, technical indicators will begin to give signals of overbought conditions. Conversely, during the same period, there will be no reversal of the general trend to bearish without a return to support levels at $2000 and $1985 per ounce, respectively.
Ready to trade our Gold forecast? We’ve shortlisted the most trusted Gold brokers in the industry for you.
